Resources for Change
FERMI
Dedicated to stopping another nuclear reactor
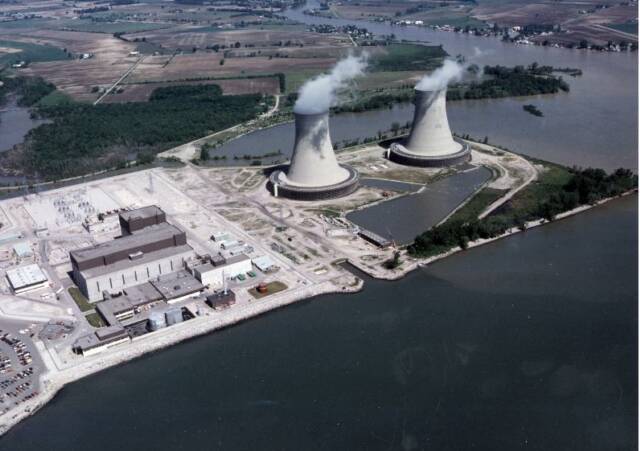
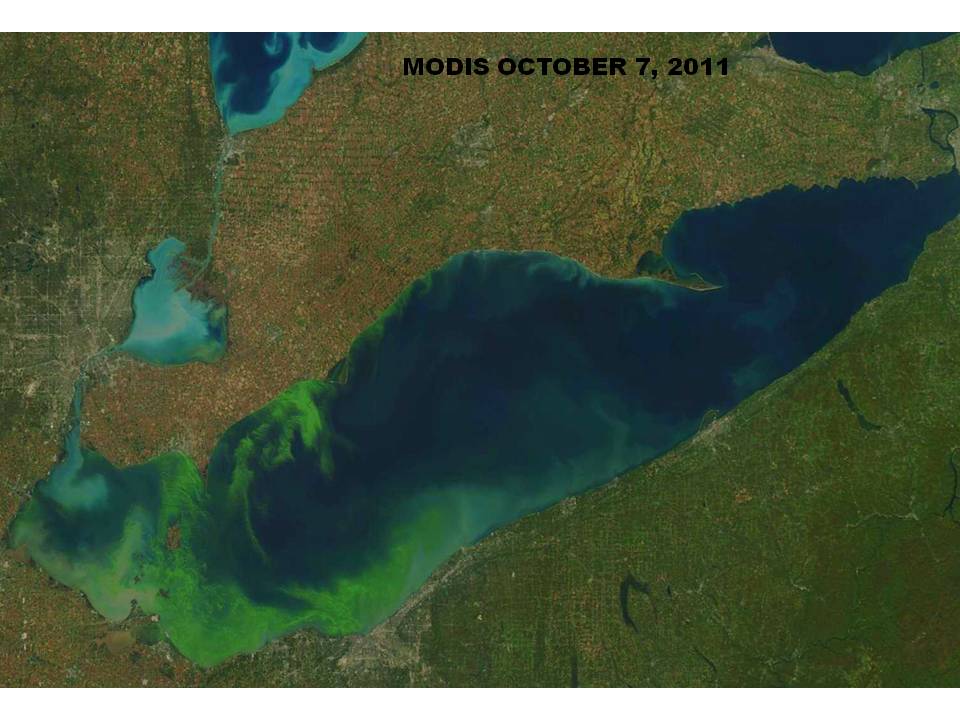
Fermi thermal-pollutes Lake Erie
Facilities kill fish, heat the waters etc.
Same GE Mach1 design as Fukushima

JOIN THE MAILING LIST
If you would like to be included the Fermi 3 update and mailing list please send that request with your name and email address using the "Contact Us" button:
Your comments to stop a Fermi 3 nuclear power plant will be appreciated by all future generations.
Although the official deadline for comment has been reached, the NRC may still consider them.
Electronic comments
may be still be sent by e-mail to the NRC at Fermi3.COLEIS@nrc.gov
January 2012: Press Releases regarding the proposed new nuclear reactor, Fermi 3:
Legal Challenges Mount For Proposed Fermi 3 Reactor
Monroe, MI... Last night filing deadline to comment on the proposed Fermi 3 Reactor did not pass without a flurry of complex legal challenges being launched. Several dozen Interventions were filed as both comments on the Draft Environmental Impact Statement (DEIS) and more formalized legal contentions were filed with the Atomic Safety and Licensing Board (ASLB). The DEIS comments fall under the jurisdiction of the National Environmental Policy Act (NEPA) and the more legal contentions filed with the ASLB fall under the jurisdiction of the Atomic Energy Act.*
The legal contentions ran the gamut including challenges on the actual need for a Fermi 3 reactor and the economics; wetlands decimation; water intakes at risk; health impacts; First Nation treaty rights; fisheries in jeopardy; thermal pollution of Lake Erie; dangerous fuel enrichment. The comments addressed areas that were clearly overlooked and omitted from the Environmental Review process, and areas which were poorly evaluated. Once again these comments were robust and comprehensive. Please find attached just a small sample of the comments made. The legal contentions before the ASLB are attached as 'Intrvnrs Comment letter Complete'. The legal Intervenors will be posting several dozen comments to the Beyond Nuclear webpage in the next few days.
For more detailed information, there are six downloadable official documents: :
Algae jpeg image (a small image is pictured to the right>)
CACCs Comments (text only)
Citizens for Alternatives to Chemical Contamination
Member of the Michigan Environmental Council and
Earth Share of Michigan
8735 Maple Grove Road, Lake, Michigan 48632-9511
Voice and Fax: 989-544-3318
Chapter Organizations:
Huron Environmental Activist League
January 12, 2012
Docket ID NRC-2008-0566
Draft Environmental Impact Statement for Combined License (COL) for Enrico Fermi Unit 3 report number: NUREG-2105
To the Nuclear Regulatory Commission:
Citizens for Alternatives to Chemical Contamination (CACC) is a 501 C3 grassroots environmental education and advocacy organization, founded in 1978 and dedicated to the principles of social and environmental justice and protection of the Great Lakes Ecosystem. CACC is an intervener before the ASLB on the proposed Fermi 3 reactor. CACC contends that the public comment period for the Fermi 3 Draft Environmental Impact Statement should be extended, by at least 60 days after the Biological Report, (essential to understanding and review of the draft EIS) is completed, released to the public and the public has adequate time to review. This is a draft Environmental Impact Statement and there is no way that the public can adequately assess this whole DEIS and the possible harm or ramifications to the environment, whether it be the health of the human community or ecosystem, upon which humans utterly depend, without access to the Biological Report. It is an unacceptable segmentation of the DEIS. The Biological Report is a fundamental part of any EIS.
Protection of people and the environment is written right into the NRC’s Mission statement, and should be your top priority, not a decision to short-change the public from critical information, in order to keep to a schedule, especially when what is being constructed is a new, untried reactor, admittedly lacking many of the critical safety systems required of other commercial reactors, (because it is heralded as "inherently safer" - even though the safety of this reactor has never been proven over time.) Merely one severe nuclear reactor accident can damage very large areas of land and water for centuries, and cause enormous damage to the health of communities and the ecosystem for generations. We protest and oppose the idea that either humans or the Great Lakes watershed should be guinea pigs for the nuclear industry. The precautionary principle states that: “When an activity raises threats of harm to human health or the environment, precautionary measures should be taken even if some cause and effect relationships are not fully established scientifically. In this context, the proponent of an activity, [in this case, the utility] rather than the public, should bear the burden of proof. The process of applying the Precautionary Principle must be open, informed [emphasis mine] and democratic and must include potentially affected parties. It must also involve an examination of the full range of alternatives, including no action." Separating this vital report from the whole of the DEIS, is designed to keep the public in the dark, and without full information or participation. Ivan Selin, former Chair of the NRC, once said that the public would have no confidence in a process they could not participate in.
Now - to assuage an industry shaken by the meltdowns and radioactive releases at Fukushima, a serious earthquake affecting nuclear plants in the northeast, cracking of the shield building at Davis-Besse, the recent loss of over half of the control room functions at Palisades, and many other unresolved management and safety issues uncovered both in the U.S. and global nuclear industry – as well as increased electrical efficiency, greater conservation by a financially and environmentally aware public, and greater competition from cleaner, safer renewable energy such as wind and solar, which do not bring the costly environmental burden of uranium mining, milling and processing, nor the unwanted lethal burden of irradiated fuel that must somehow be isolated from the biosphere for a million years or more - (all of which is bringing huge economic repercussions and a loss of public confidence) - the Nuclear Regulatory Commission wants to cut corners in the National Environmental Protection Act, so as to hurriedly build another reactor before the public has a chance to look too closely. This reactor has yet to have final approval by the U.S. NRC, yet the NRC is denying the public access to vital information about possible repercussions to the environment. A biological report is a key component of any NEPA process. The health and safety of the public or the environment appears to mean little to either the NRC or the nuclear industry.
CACC contends that the biological report is part and parcel of the environmental impact statement and the draft EIS cannot be adequately reviewed apart from that report.
Kay Cumbow, Member Education Committee
Citizens for Alternatives to Chemical Contamination
8735 Maple Grove Road Lake, MI 48632-9511
Please use this address for any correspondence:
Kay Cumbow 15184 Dudley Road, Brown City, MI 48416 TOP
Council of the Three Fires (text only)
December 21. 20 II
Peter Kent
Minister of Environment Canada
10 Wellington Street
Gatineau. Quebec KIA OH3
Canada
Via Fax: 819-953-0279
Dear Mr. Kent:
The Council of Three Fires
~~~~~~~~~~~~~
Re: Detroit Edison New Nuclear Reactor
It has come to our attention that Detroit Edison is pursuing an approval process for a new nuclear reactor on the shore of the westernmost part of Lake Erie in Newport, Michigan. This location is very close to the U.S.-Canada border, and adjacent to Lake Erie, so we expect that you have been or will be asked for your views by the proponent or by a U.S. regulatory agency.This location is also within the traditional territory of our First Nation, is close to areas where our members exercise traditional harvesting, and is about 80km from our reserve. As you may know.our First Nation has a long history of concern for the environment. has well developed environmental knowledge and expertise, and has often been involved in environmental approval processes.
It is therefore our view that given the proximity to us of this proposed new nuclear reactor,Canada is required to consult and accommodate our First Nation, in accordance with the Haida Natioll principle. regarding whatever position Canada takes concerning this project.
Please contact me to discuss how to initiate such a consultation.
Yours truly.
Joseph B. Gilbert, Chief
Walpole Island First Nation
RR #3, WALPOLE ISLAND, ONTARIO N8A 4K9 • TEL: (519) 628-5700 • FAX: (519) 627-0440 TOP
Intervention Comments (text only)
Law Office
TERRY JONATHAN LODGE
316 N. Michigan Street, Suite 520 Phone (419) 255-7552
Toledo, Ohio 43604-5627 Fax (419) 255-8582
January 11, 2012
Chief, Rules, Announcements,
and Directives Branch Office of Administration Mail Stop: TWB-05-B01M
U.S. Nuclear Regulatory Commission Washington, DC 20555-0001 Email: Fermi3.COLEIS@nrc.gov
Re: Draft Environmental Impact Statement for Combined License
(COL) for Enrico Fermi Unit 3, NUREG-2105, Docket No.
NRC-2008-0566 (Comments of intervenors in COLA proceeding)
Dear Sir or Madam:
Attached is a “Motion for Resubmission of Contention 10, to Amend/Resubmit Contention 13, and for Submission of New Contentions” fid this date by Beyond Nuclear, Citizens for Alternatives to Chemical Contamination, Citizens Environmental Alliance of Southwestern Ontar¬io, Don’t Waste Michigan, Sierra Club (Michigan Chapter), Keith Gun¬ter, Edward McArdle, Henry Newnan, Derek Coronado, Sandra Bihn, Harold
L. Stokes, Michael J. Keegan, Richard Coronado, George Steinman, Mari¬lyn R. Timmer, Leonard Mandeville, Frank Mantei, Marcee Meyers, and Shirley Steinman, all of whom are legal Intervenors in the pending Combined Operating License (COL) pending for Fermi Unit 3. On behalf of those Intervenors - my clients - we hereby submit the Motion as their public comments on the Draft Environmental Impact Statement for Fermi Unit 3.
Please add the Motion to the comment record. We look for the NRC’s comment responses, as required by NEPA.
Thank you very much.
Very truly yours,
/s/ Terry J. Lodge Counsel for Fermi 3 Intervenors
att:
UNITED STATES OF AMERICA
NUCLEAR REGULATORY COMMISSION
Before the Atomic Safety and Licensing Board
In the Matter of: )
Docket No. 52-033 The Detroit Edison Company ) (Fermi Nuclear Power Plant, Unit 3) January 11, 2012
) ; *****
MOTION FOR RESUBMISSION OF CONTENTION 10,
TO AMEND/RESUBMIT CONTENTION 13, AND FOR SUBMISSION OF NEW CONTENTIONS 17 THROUGH 24
Now come Intervenors Beyond Nuclear, et al.1 (hereinafter “Intervenors”), by and through counsel, and move to resubmit Contention 10; to amend and resubmit Contention 13 for admission to these proceedings; and to submit proposed Contentions 17 through 24 for these proceedings.
INTRODUCTION
This combined license (COL) proceeding involves the application of Detroit Edison Company (DTE or Applicant) under 10 C.F.R. Part 52, Subpart C, to construct and to operate a GE-Hitachi Economic Simplified Boiling Water Reactor (ESBWR) designated Unit 3, on its existing Fermi nuclear facility site near Newport City in Monroe County, Michigan.
The Draft Environmental Impact Statement was made public on October 28, 2011, and
1In addition to Beyond Nuclear, the Intervenors include: Citizens for Alternatives to Chemical Contamination, Citizens Environmental Alliance of Southwestern Ontario, Don’t Waste Michigan, Sierra Club (Michigan Chapter), Keith Gunter, Edward McArdle, Henry Newnan, Derek Coronado, Sandra Bihn, Harold L. Stokes, Michael J. Keegan, Richard Coronado, George Steinman, Marilyn R. Timmer, Leonard Mandeville, Frank Mantei, Marcee Meyers, and Shirley Steinman.
-1¬
public comments are due January 11, 2012.
TIMELINESS OF SUBMISSION OF CONTENTIONS
Intervenors resubmit former contentions and submit new contentions, being mindful that they have erroneously let pass the 60-day deadline set in the scheduling order for this case (i.e., 60 days after the unveiling of the DEIS, of December 27, 2012), and that at this point, they are tendering these contentions 75 days after formal announcement of the DEIS, at the close of the public comment period. That matter is addressed in a separate motion, contemporaneously filed to this one. While counsel for Intervenors apologizes to the Board, the NRC Staff and DTE for his oversight, Intervenors maintain that good cause exists for this filing to be accepted and all contentions considered by the Board.
Despite Intervenors’ error in going 15 days past the scheduling order deadline, the presumption is that the NRC, as lead agency, will adequately study the environmental issues which are engendered by the project. Crounse Corp. v. Interstate Commerce Comm’n, 781 F.2d 1176 (6th Cir. 1986). NEPA imposes continuing obligations on the NRC following completion of an environmental analysis to re-evaluate in light of new and significant information it receives which casts doubt upon a previous environmental analysis. Marsh v. Oregon Natural Resources Council, 490 U.S. 360, 374 (1989). The harm is complete under NEPA when an agency makes a decision without sufficiently considering information NEPA requires be placed before the decision-maker and public. Sierra Club v. Marsh, 872 F.2d 497, 500 (1st Cir. 1989). “The injury of an increased risk of harm due to an agency's uninformed decision is precisely the type of injury (NEPA) was designed to prevent.” Comm. to Save the Rio Hondo v. Lucero, 102 F.3d 445, 448-49 (10th Cir. 1996).
-2¬
STANDARDS FOR ADMISSIBILITY OF DEIS-RELATED CONTENTIONS
Section 10 C.F.R. §2.309(f)(2) states that “[o]n issues arising under the National Environmental Policy Act, the petitioner shall file contentions based on the applicant's envi¬onmental report.” It then provides, however, that a petitioner “may amend those contentions or file new contentions if there are data or conclusions in the NRC draft or final environmental impact statement, environmental assessment, or any supplements relating thereto, that differ significantly from the data or conclusions in the applicant's documents.” 10 C.F.R. § 2.309(f)(2).
“Thus, for example, if the DEIS contains data or conclusions concerning the costs or benefits of the proposed action that differ significantly from those contained in the Environ¬mental Report, the intervenor may file an amended contention, or an entirely new contention, to challenge the new data or conclusions.” Calvert Cliffs 3 Nuclear Project, LLC, and Unistart Nuclear Operating Services, LLC (Combined License Application for Calvert Cliffs Unit 3), LBP-10-24 at 7 (December 28, 2010 “This provision tempers the restrictive effect of the agency’s requirement that NEPA contentions be filed based on the ER by allowing petitioners or intervenors to challenge significantly different data or conclusions that appear for the first time in a NRC Staff NEPA document.” Id. at 7.
The use of the disjunctive phrase “data or conclusions” means it is sufficient that either data or conclusions in the DEIS differ significantly from those in the ER; both need not do so. A contention may therefore challenge a DEIS even though its ultimate conclusion on a particular issue (e.g., the need for power) is the same as that in the ER, as long as the DEIS relies on significantly different data than the ER to support the determination. The reverse is also true: a significantly different conclusion in the DEIS may be challenged even though it is based on the
-3¬
same information that was cited in the ER. Id. at 7.
Also, the provision refers to “conclusions,” not “the conclusion” or “all conclusions.” Thus, even though the DEIS’s ultimate conclusion on a particular issue might be the same as that in the ER (e.g., that there is a need for additional power generating capacity), other conclusions in the DEIS related to the ultimate conclusion might be challenged if they differ significantly from those in the ER. These could also be a permissible basis for a new or amended contention, even though the ultimate conclusion remains unchanged. Id. at 7.
Thus, if the DEIS for Unit 3 contains either data or conclusions that differ significantly from those in the ER, Intervenors may file their new contention challenging the DEIS even though both the ER and the DEIS reach the same result. Id. at 8.
If Intervenors fail to show that the DEIS contains new data or conclusions that differ from those in the ER, §2.309(f)(2) provides another alternative. It allows a new contention to be filed after the initial docketing with leave of the presiding officer upon a showing that:
i. The information upon which the amended or new contention is based was not previously available;
ii. The information upon which the amended or new contention is based is materially different than information previously available; and ` iii. The amended or new contention has been submitted in a timely fashion based on the availability of the subsequent information.
Id.
The regulations do not define or specify an exact number of days within which a new or amended contention must be filed in order to be considered “timely.” Accordingly, unless a deadline has been specified in the scheduling order for the proceeding, the determination of timeliness is subject to a reasonableness standard that depends on the facts and circumstances of each situation. Calvert Cliffs 3 Nuclear Project, LLC, and Unistart Nuclear Operating
-4¬
Services, LLC, LBP-10-24 at 8, citing Entergy Nuclear Vt. Yankee, LLC (Vermont Yankee
Nuclear Power Station), LBP-07-15, 66 NRC 261, 266 n.11 (2007).
If the filing of a proposed new contention is not authorized by either alternative in §2.309(f)(2), then it may be evaluated under §2.309(c). The Commission has held that, even if a petitioner is unable to show that the NRC Staff’s NEPA document differs significantly from the ER, it “may still be able to meet the late filed contention requirements.” Calvert Cliffs 3 Nuclear Project, LLC, and Unistart Nuclear Operating Services, LLC, LBP-10-24 at 8, citing Sacramento Mun. Util. Dist. (Rancho Seco Nuclear Generating Station), CLI-93-12, 37 NRC 355, 363 (1993). Similarly, if a contention based on new information fails to satisfy the three-part test of Section 2.309(f)(2)(i)–(iii), it may be evaluated under Section 2.309( c). Calvert Cliffs 3 Nuclear Project, LLC, and Unistart Nuclear Operating Services, LLC, LBP-10-24 at 8.
CONTENTIONS
CONTENTION 10 (Amended): The Walpole Island First Nation has learned of these proceedings and has petitioned the government of Canada for consultation and accommodation prefatory to joining these proceedings on the ground that tribal hunting and fishing rights, property rights and other concerns on the Great Lakes may be impaired by the construction and operation of Fermi 3.
A. Purpose of Contention
Intervenors proffered a contention in 2009 to ensure the participation of first nations people, in which they alleged non-notification of the Walpole Island First Nation as well as other native tribes, to ensure that all Native American tribes and bands and First Nations were ade¬quately notified by NRC of the Fermi 3 new reactor licensing and environmental review
-5¬
proceedings, as due to them under applicable treaties, laws, and regulations. Intervenors with¬
drew that contention voluntarily because of an inability to secure the Walpoles’ commitment to join these proceedings. Detroit Edison Company (Fermi Nuclear Power Plant, Unit 3), LBP-09¬16 at 70, fn. 196 (slip. op.). They now resubmit it.
B. Facts Relied on to Show Existence of a Genuine Dispute with the Applicant and the NRC
There has been no formal notification given the Walpole First Nation by the NRC Staff of
the pendency of these proceedings, nor the right to comment or otherwise participate as an inter¬
venor. Nonetheless, the tribe on December 21, 2011 requested that the Minister of Environment
of the federal government of Canada, where the tribe is located, consult and accommodate the
tribe. See attached letter. Specifically, the tribe has communicated this to the government of
Canada:
Peter Kent Minister of Environment Canada 10 Wellington Street Gatineau, Quebec K1A 0H3 Canada Via Fax: 819-953-0279
Re: Detroit Edison New Nuclear Reactor
Dear Mr. Kent:
It has come to our attention that Detroit Edison is pursuing an approval process for a new nuclear reactor on the shore of the westernmost part of Lake Erie in Newport, Michigan. This location is very close to the U.S.-Canada border, and adjacent to Lake Erie, so we expect that you have been or will be asked for your views by the proponent or by a U.S. regulatory agency.
This location is also within the traditional territory of our First Nation, is close to areas where our members exercise traditional harvesting, and is about 80km from our reserve. As you may know, our First Nation has a long history of concern for the environment, has well developed environmental knowledge and expertise, and has often been involved in
-6¬
environmental approval processes.
It is therefore our view that given the proximity to us of this proposed new nuclear reactor, Canada is required to consult and accommodate our First Nation, in accordance with the Haida Nation principle, regarding whatever position Canada takes concerning this project.
Please contact me to discuss how to initiate such a consultation.
Yours truly,
Joseph B. Gilbert, Chief
Walpole Island First Nation
It is anticipated that such consultation and accommodation will occur between the tribe and the federal government of Canada, based upon Canadian legal precedent, and that the end result will be that the Walpole Island First Nation will petition this Board to intervene.
C. Statement of Issues of Law and Fact to Be Raised
The Walpole Island First Nation is located about 53 miles from the proposed site of the proposed Fermi 3 atomic reactor. Walpole Island First Nation occupies unceded territory, named the Bkejwanong Territory, located on a series of islands in the St. Clair River between Michigan and Ontario, to the north and east of the proposed site of the Fermi 3 reactor.
The NRC has legal obligations under the National Environmental Policy Act (NEPA) to notify affected Native American tribes of pending significant proposals and actions, such as the Fermi 3 new reactor environmental and licensing proceedings. NRC is required under NEPA to interact with Native American tribes in a sovereign-government-to-sovereign-government manner. This is reinforced by Executive Order 12898, which incorporates the concept of “environmental justice” into decisionmaking related to environmentally controversial projects and minority populations. NRC's own regulations, specifically 10 CFR §51.28(a)(5), require the
-7¬
NRC to invite “any affected Indian tribe” to participate in the NEPA process for the new Fermi 3
reactor.
D. Explanation of the Basis for the Contention
Walpole Island First Nation would be an affected Indian tribe, should Fermi 3 be built and operated. Over one-third of the time, the prevailing winds that reach Walpole Island First Nation emanate from the direction of Fermi 3. Thus, any radiological and/or toxic chemical releases from Fermi 3, whether so-called “routine” or “permissible” releases or accidental releases, would likely reach and negatively impact Walpole Island First Nation. Besides the airborne radiological and toxic chemical risks from Fermi 3, the waterborne radiological, toxic chemical, and thermal risks are also of note. Walpole Island First Nation has hunting and fishing rights, by the Treaty of 1807 which would be implicated by Fermi 3, whether by “routine releases” of radioactivity, toxic chemicals, and thermal pollution, or by large-scale releases of radioactivity due to accident or attack at the Fermi 3 reactor.
Given that numerous species of fish, wild game, and migratory bird consumed as food by Walpole Island First Nation spend a part of their life cycle at or near the Fermi 3 site, whether in the surrounding surface waters or on land, Fermi 3’s radiological, toxic chemical and thermal pollution negatively impacts the food supply of the Walpole Island First Nation.
E. Demonstration That the Issue Raised by the Contention is Within the Scope of the Proceeding and Material to the Findings the NRC Must Make to Support its Licensing Decision
Typically, when a U.S. federal action impacts First Nations associated with the Canadian federal government, the U.S. federal agency will contact its Canadian federal counterpart. The Canadian federal agency will then provide its U.S. counterpart a list of First Nations in the
-8¬
affected area which should receive notification and an explanation of their rights in the
proceeding. Such close and careful coordination and collaboration in codified in such U.S. and Canadian binding legal arrangements as the century-old Boundary Waters Treaty, which created the U.S.-Canadian International Joint Commission (IJC) to oversee such shared natural resources as the Great Lakes. Additionally, the United States federal government has entered into various treaties with Native American tribes over the course of centuries. These treaties recognize such legally binding rights as Native American tribes’ rights to hunt and fish in certain territories, viz., the United States’ “Treaty with the Ottawa, Etc., 1807” (November 17, 1807; 7 Statute, 105; Proclamation, January 27, 1808) which states at Article V,2 “It is further agreed and stipulated, that the said Indian nations shall enjoy the privilege of hunting and fishing on the lands ceded as aforesaid, as long as they remain the property of the United States.”
The NRC further routinely recognizes the status of First Nations tribes in fulfilling its NEPA/National Historic Preservation Act responsibilities.
Intervenors state that the Commission is obligated to notify the Walpoles and other First Nations in Canada just as it must notify tribes located partly or wholly within the United States when there are transboundary environmental impacts from a project. NEPA is applicable to cases with international environmental impacts. See, e.g., the Council on Environmental Quality’s Guidance on NEPA Analyses for Transboundary Impacts3 (“NEPA requires agencies to include analysis of reasonably foreseeable trans-boundary effects of proposed actions in their analysis of proposed actions in the United States”). In Hirt v. Department of Energy, 127 F. Supp.2d 833,
2http://www.1836cora.org/pdf/1807nov17treaty.pdf 32http://ceq.eh.does.gov/nepa/regs/transguide.html
-9¬
849 (W.D. Mich. 1999), the court found that NEPA applied to an agency planning to permit the
transport of nuclear materials through the United States to the border of Canada (considering the potential impact in Canada of an accident). In light of the cross-boundary effects of a nuclear power plant’s operations and of conceivable accident scenarios, plus the fact that a large portion of southern Ontario falls within the 50-mile plume exposure pathway from Fermi (the Citizens Environmental Alliance of Southwestern Ontario, Derek Coronado and Rick Coronado, all located in Windsor, Ontario, are presently Intervenors in this case), in light of the treaty rights of the Walpole tribe, which include the waters of Lake Erie only a few hundred yards away from the Fermi 3 site, Intervenors urge that these proceedings must be waylaid to allow the Walpoles an opportunity to intervene and participate.
CONTENTION 13 (Amended): The Draft Environmental Impact Statement (DEIS) is inadequate to meet the requirements of NEPA or the Atomic Energy Act because it does not provide a reasonable cost/enefit basis for the NRC to decide to issue a combined operating license for the proposed Fermi 3 nuclear reactor. The DEIS analyses of Need for Power, Energy Alternatives and Cost/Benefit analysis are flawed and based on inaccurate, irrelevant and/or outdated information.
Intervenors consider the comments submitted on the DEIS by the Environmental Law and Policy Center to be authoritative and incorporate them herein by reference and summarize port¬ions of them as they make their case for reinstatement of Contention 13. In further support of Contention 13, Intervenors proffer the declaration statements made by their expert, Ned Ford, whose declaration, report and curriculum vitae are attached to this Motion and incorporated into it, and whose opinions are reproduced in this Motion, below.
-10¬
The NRC mandates that an EIS associated with plant licensing must include a Need for Power analysis as part of the EIS’ cost-benefit analysis. 68 FR 55905, 55909. That analysis attempts to determine whether there is future electricity need that a proposed plant could supply. In so doing, the Need for Power analysis measures the benefit of a new nuclear plant in the EIS’ cost-benefit analysis, as a plant supplying electricity that is not needed does not provide a benefit. While the Need for Power analysis “should not involve burdensome attempts to precisely identify future conditions . . . it should be sufficient to reasonably characterize the costs and benefits associated with the proposed licensing actions.” 68 FR 55910.
The Draft EIS’s Need for Power analysis fails to meet this requirement because it relies entirely on the Michigan Public Service Commission (“MPSC”) 21st Century Plan (“21st Century Plan”), a 2006 energy planning report that was prepared before the recession. DEIS pp. 8-7, 8-23. Because the electricity demand forecast contained in the 21st Century Plan was made before the recession and fails to account for the dramatic reduction in electricity demand that followed, its predicted 1.2% annual demand increase is far greater than what has actually occurred since 2007, and is much higher than current estimates of future demand. A Need for Power analysis that completely omits the second largest economic downturn in American history in its demand forecasting cannot be “sufficient to reasonably characterize” a realistic demand for power in Southeast Michigan over the next 15 years. In light of its inaccuracy, the Fermi DEIS ’ Need for Power analysis violates NEPA and does not suffice “to reasonably characterize the costs and benefits” of the proposed plant.
A comparison of the actual recent electricity demand from the last five years to the 21st Century Plan’s 1.2% annual forecast for that period shows that the recession drastically changed
-11¬
everything. Additionally, nothing suggests that the aggressive growth forecast in the 21st Century
Plan and adopted in the Draft EIS will materialize in the near future. Testimony by Detroit Edison, other Michigan and Midwest utility information, and independent demand forecasts show that the forecast of 1.2% annual growth is a significant overestimation.
Peak demand for electricity in Michigan decreased three of the five years since the 21st Century Plan was drafted, rather than steadily increasing as the Plan predicted – leading to peak demand projections that are off by orders of magnitude. While peak demand increased in 2010 and, dramatically so, in 2011, these increases were only enough to bring demand back to prerecession levels. ELPC letter.
Detroit Edison’s own testimony before the Michigan Public Service Commission antici¬pates slow demand growth and contradicts the DEIS’ demand forecast. In Detroit Edison’s “Application for Approval of Its Biennial Review and to Amend Its Energy Optimization Plan before the MPSC, the utility predicts a 0.9% annual average decrease in electricity sales between 2010 and 2015. It further does not predict any dramatic demand growth after 2015.4 DTE finds that “[t]he economy will continue its plodding recovery in 2012,” and that it does not expect any significant population growth to buoy an increase in demand since population in its service area “is expected to decline for an eighth consecutive year in 2012 and . . . will decrease for several more years.5 Overall, Detroit Edison predicts that “economic activity in Southeast Michigan will almost certainly increase in 2012 but with most measures of activity lagging pre-recession
4MPSC Case No. U-16671, The Detroit Edison Company Direct Testimony of Sherrie L. Siefman (Sept. 2011).
5Id. at SLS – 10, SLS – 12.
-12¬
levels.”6 Thus the DEIS contains a demand forecast that is directly contradicted by the same utility that is seeking a license. ELPC letter.
Too, independent demand forecasts by the U.S. Energy Information Administration (“EIA”) and the Midwest Independent Service Operator (“MISO”), although themselves likely overly optimistic, are also well below the Draft EIS’ forecast.7 The Draft EIS’ demand forecast of a 1.2% percent yearly increase is at least twice as the EIA and MISO regional projections that themselves are likely overstated. It is arbitrary and clear error for the DEIS to adopt as the main component of its cost-benefit analysis a demand forecast that is vastly greater than the licensee’s own projections and overly optimistic projections by EIA and MISO. ELPC letter.
The DEIS’s reliance on the 21st Century Plan’s demand forecast contravenes NRC guidance.. NRC’s NEPA guidance document, the Environmental Standard Review Plan (“ESRP”), requires that in order for the NRC to incorporate a Need for Power analysis that is prepared by a state or regional authority rather than the licensee, the NRC must determine that the analysis is: (1) systematic; (2) comprehensive; (3) subject to confirmation; and (4) responsive to forecasting uncertainties. NUREG-1555 (Oct. 1999); Draft EIS at 8-12. The Draft EIS’ Need for Power analysis violates this guidance document because it is neither “subject to confirm¬ation” nor “responsive to forecasting uncertainties.” The Need for Power analysis clearly disregards ESRP Guidance directing the agency to specifically include “economic recession” its analysis. See ESRP at 8.2.2-5. The DEIS contains the extraordinary finding that the 21st Century Plan’s forecast is “responsive to forecasting uncertainties” because the Plan was based on an
6Id. at SLS – 13. 7See ELPC comment letter p. 4.
-13¬
“appropriate incorporation of existing and market conditions” - the inaccurate 2006 project. DEIS at 8-14. While the 21st Century Plan may have been based on existing conditions at the time it was drafted in 2006, the conditions the Plan was based on are plainly not current for the purposes of the 2011 DEIS. ELPC letter.
The 21st Century Plan did not predict or account for the recession and, therefore, cannot reasonably be considered to be “responsive to forecasting uncertainties” in light of the known electricitymarket conditions since it was prepared. The NRC Staff’s conclusion that there is a future need for power in Detroit Edison’s service area is wrong not only because it is based on an inaccurate demand forecast that does not account for the recession, but because the Draft EIS’ use of projected demand data for the last five years, rather than actual demand data, yields an inaccurate 2025 demand projection which is the predicate for the Staff’s conclusions. The DEIS determines that peak demand in 2025 will be 15,595 MWe. Draft EIS at 8-19 (Table 8-4). However, even if one adopts the Draft EIS’ overestimate of a 1.2 percent annual demand growth, this projection does not hold up because it uses pre-recession data as a starting point. The DEIS’ 2025 demand figure is based on the 21st Century Plan’s 2006 estimates rather than readily available current peak demand numbers. Using the actual 2011 demand figure of 12,5478 MWe and still assuming an annual demand growth of 1.2 percent from 2011 to 2025 yields a 2025 peak demand of 14,828 MWe – 767 MW less than the Draft EIS projection. ELPC letter.
According to Intervenors’ expert, Ned Ford, Michigan’s overall electric industry has a similarly low capacity factor it is extremely likely that Michigan and Detroit Edison have a
8Michigan Public Service Commission, Michigan Energy Appraisal: Semiannual Projections of Energy Supply and Demand Winter Outlook 2011-2012 (Oct. 6, 2011) available at http://www.dleg. state.mi.us/mpsc/reports/energy.
-14¬
“needle peak” problem, meaning that more than twenty or thirty percent of its peak MW demand
level exists for less than ten percent of the year. Ford Report (attached). The proposed Fermi 3 station would represent a 14% addition to Detroit Edison’s reported 10,757 MWe capacity in 2011. While some documents in the DEIS suggest an assumed increase in electricity consump¬tion of nearly 50% over the next thirteen years, that would implies a 3.8% annual growth rate, which is a rate not seen in the United States since 1970. Id. Southeast Michigan’s electricity future is uncertain, highly variable, and promises some tremendous economic benefits if options are kept open to the rising wave of cheap clean energy. Fermi 3 is a good choice for only one very specific, very rigid, and increasingly unlikely possible future - provision of baseload power for wholesale distribution through the grid. Even that possible future won’t favor Fermi 3 if the cost of the plant rises too high. Ford Report.
In its 2010 application for a rate increase, Detroit Edison included a projected sales path through 2020, which shows a decline in sales from today. This is a reasonable expectation given the early strong success of the Michigan Energy Optimization program, and Detroit Edison’s high quality performance in 2010 in developing energy efficiency. Even with a substantial post-recession bounce in consumption Michigan and Detroit Edison are unlikely to see anything like a three or four percent annual growth rate. A more germane reason to examine new capacity additions is the fact that Detroit Edison’s fleet includes several dozen ancient, dirty and expensive fossil fuel plants. In fact it may turn out to be prudent to retire more than the 2,039 MW identified in the DEIS. Id.
Should Michigan’s efficiency standard be preserved at 1% annually beyond the specific years stated in PA 295 the Southeast Michigan region will have seen 15% of its total electricity
-15¬
sales met with efficiency by 2025. The actual impact will be net of new growth. Efficiency
programs such as those in Michigan are saving electricity at a cost of approximately $.02 per KWH, or less. The logic of installing efficiency measures costing less than $.03 per KWH when construction of a massive new plant which will cost 9 to 18 cents per KWH - and that, not predictable sufficiently ahead of time - should have significant appeal. Id.
Respecting alternative sources of energy, Michigan has a massive potential for onshore wind energy development, approximately 175,000 MWe of potential at 30% capacity factor and 100 meter hub heights. Id. Indeed, most of Michigan’s better wind resource is in and around the Detroit Edison Service area. Id. At a 30% capacity factor, 175,000 MWe of wind could theoretically generate the same amount of power as 58,000 MWes of nuclear power. At today’s prices for wind turbines, large swaths of the United States are prime candidates for generation of new wind power that can be sold at wholesale for six cents per KWH or less. The 30% capacity factor measure indicates economic viability at today’s prices. Michigan’s wind resource is equivalent to at least thirty-seven Fermi 3’s, when what is called for is approximately one percent of that resource, in conjunction with a strong efficiency program and a few other resource decisions. Approximately 1/3 of Fermi 3’s potential generation be met with wind power, while the other two-thirds of it can be met with efficiency and other renewable resources, a mix in which photovoltaics likely will be the most important new renewable by 2025. This combination of efficiency plus wind is a net zero cost strategy to meet Michigan’s future electricity requirements and is the only strategy that can meet Michigan’s future electricity needs without substantial increases in the price of electricity and the total cost. Efficiency savings are large enough to permit the full replacement of nuclear and fossil fuel generation as needed, provided
-16¬
the right balance of efficiency and renewables is achieved. Id.
As previously noted, Detroit Edison has a “needle peak” problem, and with a load shape like that, a massive nuclear plant, a single generating unit upon which the region would depend for 29.7% of its power or more, is simply a grossly inappropriate choice. To respond to the load shape issues, we advocate efficiency, load management, and exploration of photovoltaics as prices continue to fall. Even without photovoltaics in the mix, the variability of wind might allow Detroit Edison to utilize its existing peak generation resources more efficiently. Id.
Besides existing load management resources that make the first 30% to 40% of wind benign without substantial new load management resources to most utilities, there are a group of emerging technologies that store energy. Two in particular deserve mention, compressed air storage (CAES), which is fully technologically available, using underground caverns or above-ground storage tank systems. There are only a handful of completed utility-scale CAES projects in the world, with only one in operation in the U.S. (Louisiana) and two recently announced new projects (Nebraska and Ohio). But pricing is such that wind plus CAES can provide a 100% dispatchable electric resource at half the cost of a new coal plant per MW of capacity. Since a single MW of Compressed Air Energy Storage would typically provide storage for two or more MWe of wind generation, this is likely to erupt into a major new energy resource in the very near future. Id.
The other energy storage technology which deserves mention is Ice Storage Thermal Cooling for large commercial buildings, which is likely to supplant conventional air conditioning. It is cheap enough to produce a net benefit merely by allowing utilities to provide cooling for buildings when demand is low. Id. These and the other energy storage technologies
-17¬
are not household names or concepts, but will either be developed rapidly to protect ourselves
from higher electric costs due to more expensive resource choices, or will be developed less rapidly in response to higher electric costs due to more expensive resource choices. Id. In Michigan, electricity which costs six or seven cents per KWH, which will never experience a fuel cost increase, which will never be incapacitated by a single event at a single location, and which can bring billions of dollars of new investment and thousands of jobs should be seriously considered. Michigan is one of the top two manufacturers of wind turbine components in the United States. Id.
Photovoltaics (PV) have experienced a two-decade sustained drop in cost, and are now becoming almost ten percent cheaper each year. Id. As prices drop, the region where PV is competitive against the average cost of power becomes larger and more national. Within three to five years PV will be competitive with fossil resources in the Midwest. Id. Morever, PV is already economic if it is recognized as a peaking resource. PV always works best when the local utility experiences its daytime peak energy loads, because both are driven by sunlight. The regional market for peak power can reach multiples of the retail price of electricity very quickly. For Detroit Edison, with so much capacity needed for so few hours of the year, PV may be more economic than elsewhere in the U.S. Id. It must be remembered that, as in the case of wind power, the opportunity for DTE and for the Michigan economy is not just the potential for low cost power, but the potential for manufacturing and installation jobs, which will in turn create a foundation for those jobs and that economic activity in the DTE service area which can become economic health to ensure Detroit Edison’s own future. Id.
There is a serious economic decision facing DTE near-term respecting its coal-fired
-18¬
plants. Michigan and DTE must soon determine how to meet the pending air pollution
regulations, which decisions will affect about 61% of Detroit Edison’s generation resources, to be completed in the next two years or so, with the implementation of those decisions to be largely completed by the end of 2015. None of these determinations can be affected by Fermi 3, which will not be available for years beyond 2015. Id. However, if those decisions favor rapid expansion of efficiency and renewables in concert with the real economics and the real flexibility of those resources, it is entirely possible to provide more capability than Fermi 3 offers for a fraction of the cost. The right mix of efficiency plus renewables is likely to cost less than the current cost of electric generation from existing fossil fuel plants or a new nuclear unit through the next fifteen years and beyond. This right mix is not just cheaper than new nuclear power, it is cheaper than any other resource strategy which meets the needs of the service area and is flexible in the face of any sort of unanticipated change in the service area conditions or unanticipated change in the availability of other generation. Id.
The conventional wisdom that historically has applied to new power plant applications was not whether the utility will need additional generating capacity, but when. Commonwealth Edison Co. (Byron Nuclear Power Station, Units 1 and 2), LBP-80-30, 12 NRC 683, 691 (1980). The standard for judging the "need-for-power" was whether a forecast of demand is reasonable and additional or replacement generating capacity is needed to meet that demand. Carolina Power & Light Co. (Shearon Harris Nuclear Power Plant, Units 1-4), ALAB-490, 8 NRC 234, 237 (1978). Those days are gone, perhaps forever, in Michigan, and certainly have vanished over the coming decade and a half, which is the period in which power from Fermi 3 is conjectured to be needed. The question for Fermi 3 is most definitely “whether” the Michigan economy and
-19¬
overall electrical capacity for power generation can economically withstand, much less utilize,
addition of a huge new baseload generating facility, one which is not justifiable in terms of need and crowds out less expensive, more economically beneficial and environmentally benign alternatives, which have the added advantage of being incrementally available if, and when, the need for additional electricity generating capacity arises.
The environmental review mandated by NEPA is subject to a rule of reason. While it need not include all theoretically possible environmental effects arising out of an action, it draws direct support from the judicial interpretation of the statutory command that the NRC is obliged to make reasonable forecasts of the future. Northern States Power Co. (Prairie Island Nuclear Generating Plant, Units 1 & 2), ALAB-455, 7 NRC 41, 48, 49 (1978); Hydro Res., Inc., LBP-04-23, 60 NRC 441, 447 (2004), review declined, CLI-04-39, 60 NRC 657 (2004). In the DEIS, the NRC Staff has not made a reasonable forecast of the future need and economic jus¬tification for the proposed Fermi 3 plant.
The poorly-evaluated economics and need in justification of Fermi 3 have directly implications for meaningful consideration of alternatives. Until the preliminary matter of cost is more realistically addressed, there cannot be meaningful discussion of preferable alternatives. “The NEPA phrase ‘alternatives to the proposed action’ is understood to mean ‘alternatives to achieve the underlying purpose and need for the action.’ (See the remarks of Sen. Jackson in 115 Cong. Rec. 40,420, Dec. 20, 1969).” “Policy Issue Notation Vote,” SECY-02-0175, 9/27/02. If, under NEPA, the Commission finds that environmentally preferable alternatives exist, then it must undertake a cost-benefit balancing to determine whether such alternatives should be implemented. Florida Power & Light Co. (Turkey Point Nuclear Generating Plant, Units 3 & 4),
-20¬
ALAB-660, 14 NRC 987, 1004 (1981), citing Consumers Power Co. (Midland Plant, Units 1 & 2), ALAB 458, 7 NRC 155 (1978). “In the context of the environmental impact statement drafting process, when a reasonable alternative has been identified it must be objectively considered by the evaluating agency so as not to fall victim to ‘the sort of tendentious decisionmaking that NEPA seeks to avoid.’” Private Fuel Storage, L.L.C. (Independent Spent Fuel Storage Installation), LBP-01-34, 54 NRC 293, 302 (2001), citing I-291 Why? Association
v. Burns, 372 F. Supp. 223, 253 (D. Conn. 1974), aff’d 517 F.2d 1077 (2d Cir. 1975). A hard look for a superior alternative is a condition precedent to a licensing determination that an applicant's proposal is acceptable under NEPA. Public Service Co. of New Hampshire (Seabrook Station, Units 1 & 2), ALAB-471, 7 NRC 477, 513 (1978).
It is precisely a hard, serious look that is missing from the DEIS discussion of alternatives because of the imcomplete and skewed need analysis presented by the NRC Staff. NEPA’s implementing regulations recognize that the consideration of alternatives is "the heart of the environmental impact statement" 40 CFR §1502.14, but in this DEIS, the heart is porous.
Pursuant to NEPA §102(2)(E), the Staff must analyze possible alternatives, even if it believes that such alternatives need not be considered because the proposed action does not significantly affect the environment. "Some factual basis (usually in the form of the Staff's environmental analysis) is necessary to determine whether a proposal 'involves unresolved conflicts concerning alternative uses of available resources' - the statutory standard of Section 102(2)(E)." Virginia Electric & Power Co. (North Anna Power Station, Units 1 & 2), LBP-85¬34, 22 NRC 481, 491 (1985), quoting Consumers Power Co. (Big Rock Point Nuclear Plant), ALAB-636, 13 NRC 312, 332 (1981). See also Vermont Yankee Nuclear Power Corp. (Vermont
-21¬
Yankee Nuclear Power Station), LBP-88-26, 28 NRC 440, 449-50 (1988), reconsidered, LBP-89¬
6, 29 NRC 127, 134-35 (1989), rev'd on other grounds, ALAB-919, 30 NRC 29 (1989).
CONTENTION 17: The descriptions of terrestrial and wetland mitigation plans are insufficient and inadequate, legally and practically, in violation of NEPA requirements for a Draft Environmental Impact Statement.
At DEIS Vol. 1 p. 4-44 appears this statement:
Any impacts on terrestrial or wetland ecological resources associated with the compensatory mitigation proposed by Detroit Edison would be evaluated by the USACE and MEDQ as part of th permitting process for that activity. It is anticipated that this
process will be completed prior to issuance of the final Fermi 3 EIS. The record compiled by the agency must be sufficient to determine the mitigation measures being used to compensate for adverse environmental impacts stemming from the original proposal that, unmitigated, would be significant. Spiller v. White, 352 F.3d 235, 241 (5th Cir.2003) (quoting Cabinet Mountains Wilderness v. Peterson, 685 F.2d 678, 682 (D.C.Cir.1982)). Although proposed mitigation measures need not be laid out to the finest detail, even within the more labor-intensive context of an environmental impact statement, Robertson v. Methow Valley Citizens Council, 490 U.S. 332, 352, 109 S.Ct. 1835, 104 L.Ed.2d 351 (1989) , it is still required “that mitigation be discussed in sufficient detail to ensure that environmental consequences have been fairly evaluated.” Miss. River Basin Alliance v. Westphal, 230 F.3d 170, 176-77 (5th Cir.2000) (quoting Robertson, 490 U.S. at 352, 109 S.Ct. 1835). An EIS involving mitigation must include “a serious and thorough evaluation of environmental mitigation options for [a] Project to allow its analysis to fulfill NEPA's process-oriented requirements [.]” Miss. River Basin Alliance, 230 F.3d at 178.
But in the instance of Fermi 3, the NRC Staff expects Intervenors and the public to forego
-22¬
public comment opportunity on terrestrial and/or wetland mitigation plans at the DEIS stage for want of information disclosure in a timely fashion. Intervenors and the public are being asked to potentially forfeit rights accruing from having that option available.
The harm to a public plaintiff in a NEPA circumstance is complete when an agency makes a decision without sufficiently considering information NEPA requires be placed before the decision-maker and public. Sierra Club v. Marsh, 872 F.2d 497, 500 (1st Cir. 1989). That information includes comments and feedback from public participants; the courts expect that "Persons challenging an agency's compliance with NEPA must structure their participation so that it... alerts the agency to the [parties'] position and contentions,' in order to allow the agency to give the issue meaningful consideration." Dep't of Transp. v. Pub. Citizen, 541 U.S. 752, 764 (2004). Plaintiffs “waive their right to challenge [the final NEPA result} if “they did not raise that issue during the administrative process"). Protect Lake Pleasant, LLC v. Connor, No. CIV 07-454-PHX-RCB, 2010 WL 5638735, at *37 (D.Ariz. July 30, 2010).
Here, Intervenors and the public are being deprived of a comment right accorded them under NEPA by not having access to mitigation plans contemporaneously and as a part of the DEIS stage.
CONTENTION 18: The Endangered Species Act consultation and biological assess¬ment (“BA”) are incomplete, and there is no adequate substitute for the BA which appears within the DEIS. This makes the DEIS dependent upon completion of the BA and as a practical matter, precludes the public a participation/comment opportunity on the Endnagered species Act at the DEIS stage. This disclosure violates NEPA requirements for a Draft Environmental Impact Statement.
-23¬
At pp. 5-21 - 5.22 of the DEIS appears this passage:
To meet responsibilities under Section 7 of the U.S. Endangered Species Act of
1973 (ESA), the review team will prepare a Biological Assessment (BA) prior to issuance
of the final EIS that will evaluate potential impacts of preconstruction, 1 construction,
and operations on Federally listed threatened or endangered aquatic and terrestrial
species.
For any federal action that may affect a threatened or endangered species, the agency contemplating the action must undertake a "Section 7" consultation with the consulting agency to ensure that the federal action is not likely to jeopardize "the continued existence of" an endan¬gered or threatened species and will not result in the "destruction or adverse modification" of the designated critical habitat of the listed species. 16 U.S.C. §1536(a)(2); see Gifford Pinchot Task Force v. U.S. Fish and Wildlife Service, 378 F.3d 1059, 1063 (9th Cir. 2004).
The agency is required to ask FWS in writing, whether, in its opinion, a listed or proposed species may be present in the action area. 16 U.S.C. §1536(c)(1). If FWS responds that no protected species are present, the consultation requirement ends. If, however, FWS responds that there may be an endangered or threatened species in the action area, the agency is required to prepare a biological assessment (“BA”), which identifies any listed species within the area and evaluates the potential effects of the action on those species. 16 U.S.C. §1536(c)(1); 50 C.F.R. §402.02.
The consultation process concludes with the consulting agency issuing a Biological Opinion. See Ariz. Cattle Growers' Assoc. v. United States Fish and Wildlife Serv., 273 F.3d 1229, 1239 (9th Cir. 2001). This opinion must address both jeopardy and critical habitat by considering the current status of the species, the environmental baseline, the effects of the proposed action, and the cumulative effects of the proposed action. Gifford Pinchot, 378 F.3d at
-24¬
1063. In formulating its biological opinion, the agency "shall use the best scientific and commer¬
cial data available." 16 U.S.C. § 1536(a)(2); see 50 C.F.R. § 402.14(g)(8); Pacific Coast Fed'n of Fishermen's Ass'n, Inc. v. National Marine Fisheries Service, 265 F.3d 1028, 1034 (9th Cir. 2001).
The BA requirement can be fulfilled as part of the agency's procedural requirements established by the National Environmental Policy Act of 1969 (“NEPA”), 42 U.S.C. §4332. 16
U.S.C. §1536(c)(1). Similarly to NEPA, a BA is required for all federal actions which constitute a “major construction activity,” whether or not a listed species is suspected in the area. 50 C.F.R. §402.12(b)(1). A “major construction activity” is defined as “a construction project (or other undertaking having similar physical impacts) which is a major Federal action significantly affecting the quality of the human environment as referred to in [NEPA, 42 U.S.C. §4332(2)(C)].” 50 C.F.R. §402.02. The term “major” reinforces the term “significantly,” but has no meaning independent of it. Andrus v. Sierra Club, 442 U.S. 347, 364 n. 23, 99 S.Ct. 2335, 2344 n. 23, 60 L.Ed.2d 943 (1979); 40 C.F.R. § 1508.18. The regulations promulgated to institute NEPA also specifically provide that “major” actions include approving permits for construction. 40 C.F.R. §1508.18(b)(4).
When an agency prepares an EIS, it is complying with the BA requirement of 16 U.S.C. § 1536( c), provided that one of the environmental impacts discussed is the impact on threatened and endangered species. Sierra Club v. U.S. Army Corps Engineers, 295 F.3d 1209, 1220 (9th Cir. 2002).
The problem here is that there is no biological assessment included within the DEIS, but instead, a promise that one will be performed in the future. This deprives the public of an
-25¬
adequate comment opportunity at the DEIS stage; all it has before it is a “plan to have a plan.”
The harm to a public plaintiff in a NEPA circumstance is complete when an agency makes a decision without sufficiently considering information NEPA requires be placed before the decision-maker and public. Sierra Club v. Marsh, 872 F.2d 497, 500 (1st Cir. 1989). That information includes comments and feedback from public participants; the courts expect that "Persons challenging an agency's compliance with NEPA must structure their participation so that it... alerts the agency to the [parties'] position and contentions,' in order to allow the agency to give the issue meaningful consideration." Dep't of Transp. v. Pub. Citizen, 541 U.S. 752, 764 (2004). Plaintiffs “waive their right to challenge [the final NEPA result} if “they did not raise that issue during the administrative process"). Protect Lake Pleasant, LLC v. Connor, No. CIV 07-454-PHX-RCB, 2010 WL 5638735, at *37 (D.Ariz. July 30, 2010).
Here, Intervenors and the public are being deprived of a comment right accorded them under NEPA by not having access to the result of the ESA consultation and any biological assessment that results, as a part of the DEIS stage.
CONTENTION 19: Consumptive water uses from the Great Lakes Basin have not been properly addressed in accordance with the Great Lakes Compact, and the required approval process and approvals, if any, are not delineated in the DEIS, in violation of NEPA.
.Intervenors cite in support of this contention the comment letter submitted by the Great Lakes Environmental Law Center (GLELC), an expert organization located in Detroit which associates with the Wayne State University Law School’s Environmental Law Clinic. GLELC’s comments are of sufficient quality to be considered as the following three contentions.
The DEIS analyzes the effect of the Fermi 3 project, including water consumption, on the
-26¬
adjacent bodies of water. Although there are impacts to groundwater and adjacent streams in the
construction of Fermi 3, “the primary water body of concern is Lake Erie, which would be the sole source of water to Fermi 3 and would receive the majority of the discharged from Fermi 3.” DEIS at 2-26.
With Lake Erie under increasing stress from various uses and interests, and tensions increasing due to the presence of so many different interests and actors trying to manage one large hydrologic system, the various states and provinces created and ratified the Great Lakes Compact in 2008 as a framework to “act together to protect, conserve, restore, improve and effectively manage the Waters and Water Dependent Natural Resources of the Basin under appropriate arrangements for intergovernmental cooperation and consultation.” Great Lakes Compact § 1.3(2)(a). Within this framework, the states created a system by which all actors attempting to withdraw or consume large amounts water from the Great Lakes must seek approval from the various state actors that are party to the agreement. The review team accurately cites this approval requirement with the DEIS, stating that “with the passing of the Great Lakes Compact in 2008, any new water withdrawals within the Great Lakes Basin that would result in a consumptive use of 5 MGD [million gallons per day] or more were made subject to review by all of the States and provinces in the region.” DEIS at 2-25. This requirement, however, is merely mentioned within a single section and is not properly addressed by the DEIS.
With an estimated consumptive footprint of 20-25 million gallons per day, the Fermi 3 facility will most certainly be subject to a “regional review” from the various states and provinces within the Compact. Id. at 5-8. The review by the states and provinces will likely require voluminous information from Detroit Edison in order to gain approval from the Parties for their
-27¬
desired levels of withdrawal and consumption. Great Lakes Compact §4.3. Each party will be
able to review whether Edison’s proposed usage is consistent with the Compact based on a number of factors, most notably whether “withdrawal or consumptive use will be implemented so as to ensure that the Proposal will result in no significant individual or cumulative adverse impacts to the quantity or quality of the Waters and Water Dependent Natural Resources and the applicable Source Watershed” and whether “the withdrawal or consumptive use will be implemented so as to incorporate Environmentally Sound and Economically Feasible Water Conservation Measures.” Great Lakes Compact §4.11. Based on the statistics given within the DEIS, Edison and the reviewing agencies will likely find that standard difficult to meet.
The DEIS states that the Fermi 3 facility will withdraw around 50 MGD of water, and consume about half that; 20-25 MGD. DEIS at 5-8. In comparison, the reviewing agencies note that “between 2000 and 2006, the US and Canadian power plants withdrew an average of 168 MGD from Lake Erie and consumed an average of 14 MGD, amounting to an average consump¬tion rate of 8%.” Id. at 2-23. Fermi 2, which accounted for about half of that average daily withdrawal for the entire lake, had a consumption rate of about 40%, far higher than other facilities. Id. Therefore, the proposed Fermi 3 facility, while withdrawing less water than its counterpart Fermi 2, will actually consume a great deal more water. In fact, the Fermi 3 plant will consume far more water per day than all of the nuclear facilities on Lake Erie combined on average from 2000-2006. Id. at 2-23.
The review team states in the DEIS that an estimated annual consumption of 7.6 billion gallons of water would only amount to about 4% of the current total consumptive use of Lake Erie, dismissing this percentage as a small impact and concluding that mitigation is not
-28¬
warranted. Id. at 5-8, 5-9. With this new facility estimated to take up such a large amount of
consumptive use in comparison to its peer facilities and industrial use as a whole, the Party states to the Compact may not agree with the reviewing agencies under the standard of review set forth in the Great Lakes Compact, and find the use per se unreasonable. When looking at the long-term health of the Great Lakes Basin, the Party states are likely to note that climate change could put increasing pressure on the lake as water levels decrease and consumption from all sectors increases. The DEIS notes that “potential increases in Lake Erie water temperature resulting from climate change could increase the amount of cooling water needed for operation of the proposed Fermi 3 and other major users. Therefore, the operations of Fermi and other thermoelectric plants on Lake Erie could be altered as a result of climate change.” Id. at 7-10, 7-11.
Because of the uncertainty inherent in gaining approval from the regional review process under the Great Lakes Compact for a project this size, the GLELC recommends, and Intervenors concur, that certain actions by the applicant and the reviewing agencies are indicated. First, steps should be taken to initiate an approval process under the terms of the Great Lakes Compact. Perhaps by noting the Compact review requirement in the DEIS without addressing it, the review team understands the requirements of the Compact to be separate from those that need to be outlined in an EIS process; it may in fact be an operational issue and not a construction issue, for example. However, it is clear that an approval through the regional review process of the Compact is necessary in order for the Fermi 3 facility to operate. Second, the reviewing agencies should include in the Final EIS the steps that will be taken by the relevant parties to seek and gain approval by the parties of the Compact. Included in these steps should be an explanation of why the Fermi 3 facility’s large consumptive use of water, in comparison to its counterpart
-29¬
facility Fermi 2 as well as other peer facilities in the region, should be allowed in accordance
with the principles of the Great Lakes Compact.
CONTENTION 20: The DEIS does not adequately evaluate thermal pollution issues associated with the discharge of cooling water into Lake Erie, in violation of NEPA.
The DEIS notes the issues with thermal pollution on its discharge cooling water into Lake Erie but does not properly evaluate these issues as serious and fails to provide potential miti¬gation options for the Fermi 3 facility. Lake Erie is under a number of stresses, and in particular the stress caused by warmer temperatures has lead to historically bad algae blooms that create a toxic environment for much of the natural aquatic flora and fauna. The review team notes this, stating that “current water quality concerns with regard to Lake Erie include (1) increased phosphorus loading from regional agricultural activities, which cause toxic algal blooms.” DEIS at 2-26. Additionally, the reviewing agencies also determined through sampling that area of lake adjacent to Fermi 3 was consistent with other stressed areas of the lake, with “elevated levels of nutrients including total phosphorus, orthophosphorus, nitrate and nitrite nitrogen, and total Kjeldahl nitrogen.” Id. at 2-28. An increase of localized temperature caused by a large and steady discharge of cooling water could therefore have a deleterious effect on Lake Erie’s ability to regulate its own toxicity. Nonetheless, the reviewing agencies determined that thermal pollution potentially caused by the Fermi 3 facility would have a minimal impact on Lake Erie, and did not recommend any mitigation strategies for Edison.
In determining the possible impact of thermal pollution, the DEIS looks to the Michigan Water Quality Standards, which include temperature limits for Lake Erie, including mixing zone limits and applicability of the standards. These regulations state that the “Great Lakes and
-30¬
connecting waters shall not receive a heat load which would warm the receiving water at the edge of the mixing zone more than 3 degrees Fahrenheit above the existing natural water tempera¬ture.” MI Admin. R. 323.1070(1). Based on Lake Erie’s mean monthly temperature, the regula¬tions give specific heat limits over which, if occurring outside of a designated mixing zone area, the temperature becomes a thermal plume. DEIS at 5-11. Approval of the size of the mixing zone varies depending on the size of the thermal plume and the body of water and is determined in the discharge permitting process, which has yet to occur. MI Admin. R. 323.1082(4).
To investigate the potential impacts of discharged cooling water with elevated tempera¬tures on Lake Erie, Detroit Edison used a hydrodynamic model that simulates mixing processes, to evaluate the average impact and size of discharged thermal plumes. DEIS at 5-12. Based on the simulations performed under this modeling framework, DTE found that in 9 of 12 months each year, the average temperature of the potential thermal plume will be above the maximum temperature allowed under Michigan regulations. Id. Additionally, in three months out of the year, the difference between the mean temperature of the discharge and the mean ambient lake temperature will be over 20 degrees Fahrenheit. Id. Important to note within these results is that they measure mean temperature differences, which indicates that in many instances throughout the month the temperature differences will be even larger.
Noting that the thermal plume would not be large enough to reach the shoreline (primarily due to the lengthy discharge pipe called for in the design of the facility), and enormous size of the basin into which the thermal plume would be discharged, the reviewing agencies determined that the thermal pollution would have minimal environmental impact on Lake Erie and did not suggest mitigation or alternatives to the current discharge plan. Id. at 5-7; 5-16. This analysis is
-31¬
poorly framed, particularly when future projections which factor in the impact of climate change
are taken into account.
The projections based on Edison’s simulations show a thermal plume that could poten¬tially be as large as 55,000 square feet. DEIS at 5-2; 7-14. While this plume is a “small fraction of the western basin of Lake Erie,” at a localized level it could be enormously damaging, espec¬ially if the temperatures are upwards of 20 degrees Fahrenheit warmer than the mean natural temperature of the lake. This thermal pollution could result in drastic growth of toxic algae, heat stress for aquatic life, and, as the DEIS states, “the creation of favorable conditions for invasive species.” Id. at 5-33. Furthermore, in their analysis of possible impacts, the reviewing agencies indicate that climate change could exacerbate the issues caused by thermal plumes. Climate change could lower lake levels, causing large thermal plumes and mixing zones caused by the shallow depths at the area of discharge (already as low as 7 feet in some areas) to expand further. Id. at 7-14. Additionally, as previously noted, higher average lake temperatures would lead to greater water withdrawals to achieve the same cooling effectiveness. The larger withdrawals would also lead to larger discharges, which could create even larger thermal plumes at the shallower depths. Id. at 7-11; 7-14.
Intervenors concur with the GLELC, and recommend that the reviewing agencies reevaluate the potential problems caused by thermal pollution from coolant water discharges at a more localized level before producing the Final EIS. The review team did suggest two mitigation procedures within the DEIS, the installation of a diffuser that would mix the discharge before being released into the lake and a procedure to gradually reduce the discharge of cooling water during plant shutdowns to avoid any sort or heat or cold shock to aquatic species. DEIS at 5-7; 5¬
-32¬
35. These are positive mitigation procedures but not adequate to properly address the extent of harm that the volume of warm effluent being released by the facility. It should be noted that, as the Great Lakes Compact monitors both consumption and withdrawals, the discharge of thermal pollution as a result of a withdrawal would also be subject to a review under §4.11 of the Compact. Therefore, it would be prudent for both Edison and the regulatory agencies tasked with approving Fermi 3 to ensure that the thermal plumes being discharged into Lake Erie “result in no significant individual or cumulative adverse impacts to the quantity or quality of the Waters and Water Dependent Natural Resources and the applicable Source Watershed.” Great Lakes Compact §4.11.
CONTENTION 21: Evaluation of the wetland areas that would be impacted by the construction and operation of the reactor, and the potential status of selected wildlife within those areas, is not fully and properly addressed in the DEIS, in violation of NEPA.
The majority of the Fermi site, which includes Fermi 3 as well as the currently operating Fermi 2, is currently characterized as surface wetlands within the coastal zone of Lake Erie. DEIS at 2-13; 2-14. Approximately 656 acres of undeveloped lands on the Fermi site are managed as part of the Detroit River International Wildlife Refuge. Id. at 2-14. Wetlands are a unique habitat and provide a number of different benefits to human society and the environment, and thus they are protected by both state and federal laws requiring permits from both state and federal agencies. Id. at 2-53. In this case, the wetlands on the Fermi site are particularly valuable in shielding the area from flooding, as well as providing habitat for a number of species. Id. at 2¬57; 2-58.
Between the construction and operation of the Fermi 3 facility, about 19 of the 656 acres
-33¬
of coastal wetlands would be permanently converted. Id. at 5-23. Additionally, the new facility will require some auxiliary support structures, transmission lines, and vehicular access roads, making up a transmission corridor travelling to the edge of the Fermi site that will further cause temporary destruction or soil erosion in another 93.4 acres of inland wetlands. Id. at 5-39; 7-21. Edison has already submitted a Joint Permit Application to both the MDEQ and USACE in order to fill these wetlands as part of construction. Within the DEIS, the reviewing agencies deter¬mined that mitigation was necessary and would be performed through 82 acres of coastal wetland restoration at an offsite location on Lake Erie as well as 21 acres of onsite restoration as proposed by DTE within its §404 permit. Id. at 7-20.
Intervenors concur with the GLELC in the belief this mitigation plan is bereft of details within the pages of the DEIS. Further investigation into communications between the USACE and Edison reveal that as of December 2011, the USACE had still not verified the adequacy of the applicant’s avoidance and minimization statement, and therefore its compensatory mitigation plan. U.S. Army Corps of Engineers Public Notice Re: Application of Detroit Edison No. LRE¬2008-00443-1-S11 at 5. The Federal Regulations state that compensatory mitigation may only be employed after all appropriate and practical steps to avoid and minimize adverse impacts to aquatic resources, including wetlands and streams, have been taken. 33 CFR 325 et seq. The USACE needs to confirm both the necessary conversion of the wetlands on site as well as the proposed mitigation from the 404 application if it is to move forward properly. The EIS should also include proposed mitigation measures that take the potential effects of climate change on the wetland areas into account. Prolonged higher temperatures could cause increased evaporation rates, which, along with the greater likelihood of drought, could reduce the extent of wetlands in
-34¬
the area.” Id. at 7-18.
In analyzing the effect of possible conversion of wetlands in the DEIS, the review team noted that there were possible threatened species that may be effected by the elimination of wetlands, and more specifically, by the creation of infrastructure and access roads within the wetlands. The DEIS noted first, that the creation of access roads creates a moderate threat to the status of the Eastern Fox Snake, listed by the State of Michigan as Threatened, due to possible vehicle mortality. DEIS at 5-142; 7-16. The DEIS also reported a potential impact to the American Lotus, also listed by the State as Threatened, due to construction activities. Id. at 7-20. In both cases the regulatory agencies made note that Edison would work together with the Michigan Department of Natural Resources to create protections for those Threatened species. No specific protection plans are in place at this time however, and these protections must be published and available for public comments prior to inclusion in the Final EIS.
The harm to tje public under NEPA is complete when an agency makes a decision without sufficiently considering information NEPA requires be placed before the decision-maker and public. Sierra Club v. Marsh, 872 F.2d 497, 500 (1st Cir. 1989). That information includes comments and feedback from public participants; the courts expect that "Persons challenging an agency's compliance with NEPA must structure their participation so that it... alerts the agency to the [parties'] position and contentions,' in order to allow the agency to give the issue meaningful consideration." Dep't of Transp. v. Pub. Citizen, 541 U.S. 752, 764 (2004). Plaintiffs “waive their right to challenge [the final NEPA result} if “they did not raise that issue during the administrative process"). Protect Lake Pleasant, LLC v. Connor, No. CIV 07-454-PHX-RCB, 2010 WL 5638735, at *37 (D.Ariz. July 30, 2010).
-35¬
Here, Intervenors and the public are being deprived of a participation right accorded them
under NEPA by not having access to the specific protection plans for endangered and threatened species at the DEIS stage, in order to comment and make their positions on significant environmental issues known.
CONTENTION 22: The DEIS calls for scrutiny only transportation aspects of the use of unusually enriched fuel in the Fermi 3 reactor, which is not adequately disclosed, nor is there analysis of the potential reactor operations accident implications from use of higher-enriched fuel for fissioning, nor evaluation of the increased potential for higher levels of emissions of radioactivity in air and water from normal operations.
At p. 6-19 of the DEIS appears this passage:
In its application, Detroit Edison requested a COL for an additional reactor at its Fermi site in Monroe County, Michigan. The proposed new reactor would be a GE-Hitachi ESBWR. The ESBWR has a thermal power rating of 4500 MW(t), with a gross electrical rating of 1605 MW(e). This thermal power rating exceeds the 3800-MW(t) limit considered in 10 CFR 51.52. The net electrical output is expected to be approximately 1535 MW(e) as the Fermi 3 power consumption is expected to be 70 MW(e) (Detroit Edison 2011). Fuel for the plants would be enriched up to about 4.6 weight percent uranium-235, which exceeds the 10 CFR 51.52(a) condition. In addition, the expected irradiation level of about 46,000 MWd/MTU exceeds the 10 CFR 51.52(a)
condition. Therefore, a full description and detailed analysis of transportation impacts is required. Intervenors are concerned about the transportation consequences of transporting fuel
which is beyond the 4% U-235 limit established by 10 CFR 51.52 as it is shipped to the Fermi 3 as unirradiated fuel. We are certainly concerned about that fuel as spent fuel being shipped away from Fermi 3 again exceeding the limit of 10 CFR 51.52. This has not been adequately addressed in the Environmental Report or in the DEIS. This is an omission.What is of particular concern to Intervenors is the use of such enriched fuel at 4.6% U-235 (by weight) running above 4500 MW
-36¬
thermal, both enrichment and temperature well above the 10 CFR 51.52 specifications. This is not addressed in the Environmental Report or in the DEIS.
Use of fuel enriched at 4.6% is one of with many firsts for this huge scale ESBWR not yet certified and never tested. Below is a listing drawn from ESBWR DCD Tier 2 Chapter 1 table 1.3-1. This proposed ESBWR (compared to other BWR's of BWR1 and ABWR) reactor would have the largest of:
>Core average exit quality steam at 25%. (vs 6.5% or 14.5%)
> Fuel enrichment at 4.6% (not below 4% U-235 as called for in 10 CFR 51.52)
> Fuel rod array of 10 x 10 (vs a 6x6 or 8x8)
> Number of fuel bundles of 1132 (vs 156 or 872)
> Fuel weight of UO2 kg 184,867 / 407,562 lbm (vs 10,750 kg / (23,704) lbm or 172,012 kg / (379,221) lbm)
> Core Diameter of 5883 mm / 231.6 inches. (vs.
> Number of control rods at 269. (vs 37 or 205)
This is the most fuel ever assembled in a reactor (184 tons), at an enrichment of 4.6% U¬235 by weight, in the largest fuel rod array of any BWR. Fermi 3 will contain the most fuel bundles (1132), will exceed 10 CFR 51.52 criteria for thermal by at least 700 MWT at 4500 MWT. The core diameter would be the largest ever (5883 mm / 231.6 inches). These are all firsts, and all largest in a BWR design ever. The NRC reports in the DEIS that:
In its ER (Detroit Edison 2011), Detroit Edison provided a full description and detailed analyses of transportation impacts. In these analyses, radiological impacts of transporting fuel and waste to and from the Fermi site and alternative sites were calculated by Detroit Edison using the RADTRAN 5.6 computer code (Weiner et al. 2008). For this EIS, the NRC staff estimated the radiological impacts of transporting fuel and waste to and from the Fermi site and alternative sites using the RADTRAN 5.6
-37¬
computer code. RADTRAN 5.6 is the most commonly used transportation impact analysis computer code in the nuclear industry, and the NRC staff concludes that the code is an acceptable analysis method.
There is no discussion in the DEIS or in the Environmental Report of the increased risk of
running an untested, skeletally designed, largest, hottest, most fueled, most enriched, largest fuel
rod array configuration reactor. The DEIS and Environmental Report does not address mitigation
from such an escalated risk brought forth by these design dynamics. The proposed Fermi 3
ESBWR design reactor is the proverbial “Twisting the Tiger by the Tail” scenario. These tables
suggest why:
ESBWR Design Control Document/Tier 2 1.3-2 Table 1.3-1 Comparison of Reactor System Design Characteristics Design Characteristic (1) (2) Units ESBWR to the BWR/1 Dodewaard and to the ABWR Thermal and Hydraulic (Section 4.4) ESBWR BWR/1 ABWR Vessel inside diameter m (in) 7.06 (278) 2.79 (110) 7.06 (278) Number of fuel bundles 1132 156 872 Rated power MWt 4500 163.4 3926 Design power(ECCS design basis)MWt 4590 196 4005 Steam flow rate Metric ton/hr (Mlbm/hr) 8757 (5) (19.307) 256 (0.564) 7640 (16.843) Core coolant flow rate Metric ton/hr(Mlbm/hr) 34,453(75.955) 4500 (9.92) 52,200
(115.1) Feed water flow rate Metric ton/hr(Mlbm/hr) 8736 (19.260) ~243 (~0.54) 7624 (16.807) Absolute pressure in steam dome Mpa (psia) 7.17 (1040) 7.10 (1030) 7.17 (1040) Average power density kW/liter 54.3 36.3 50.6 Maximum linear heat generation ratekW /m(kW/ft) 44.0 (13.4) 50.1 (15.3) 44.0 (13.4) Average linear heat generation rate kW/m (kW/ft) 15.1 (4.6) 17.8 (5.4) 20.3 (6.2) Average heat flux kW/m2 (Btu/hr-ft2) 458.53 (145,430) 367.57 (116,630) 524.86(166,470) Operating limit MCPR 1.31 (7) N/A 1.17 Coolant enthalpy at core inlet kJ/kg ESBWR BWR/1 ABWR (Btu/lbm) 1190 (511.7) 1240 (533.8) 1230 (527.7) Maximum void fraction within fuel assemblies 0.90 0.64 0.75
1.3-3 Table 1.3-1
-38¬
Comparison of Reactor System Design CharacteristicsDesign Characteristic (1) (2) Units ESBWR BWR/1 ABWR Core average exit quality % steam 25 6.6 14.5 Feedwater temperature °C / (°F) 215.6 (3) /(420) 125/ (257) 215.6 /(420) Design power peaking factor Maximum relative assembly power 1.33 1.30 1.40 Local peaking factor 1.36 1.15 1.25 Axial peaking factor 1.44 1.55 1.40 Total peaking factor 2.60 2.32 2.45 Nuclear (first core) (Section 4.3) Water/UO2 volume ratio (cold) 2.90 2.6 2.95Reactivity with highest reactivity worth control rod out Keff <0.99 <0.99 <0.99 Initial average U235 enrichment (%) 2.08 2.50 2.22 Initial cycle exposure MWd/MTU (Mwd/STU) 11,750(10,660) 17,600(16,000) 10,945(9,950) Fuel Assembly (Section 4.2) Fuel rod array 10x10 6x6 8x8 Number of fuel rods per assembly 92 36 62 Fuel rod cladding material Zircaloy-2 Zircaloy-2 Zircaloy-2 Overall length cm(in) 379 (149) 179 (70.5) 447 (176) 1.3-4 Table 1.3-1 Comparison of Reactor System Design Characteristics Design Characteristic (1) (2) Units ESBWR BWR/1 ABWR Weight of UO2 per assembly kg (lbm) 163 (360) 68.9(152) 197 (435) Weight of fuel assembly (includeschannel without UO2) kg (lbm) 78 (172) 101 (223) 109
(240) Fuel Channel (Section 4.2) mm 3.05/1.91 1.5 2.5 (in) (0.120 /0.075) (0.06) (0.100) Cross section dimension mm 140 110 139 (in) (5.52) (4.35) (5.48) Material Zircaloy-2 Zircaloy-4 Zircaloy-4 Core Assembly (Section 4.1) Fuel weight as UO2 kg 184,867 10,750 172,012(lbm) (407,562) (23,704) (379,221) Core diameter (equivalent) mm 5883 1788 5164 (in) (231.6) (70.39) (203.3) Active fuel length mm 3048 1793 3708
(in) (120.0) (70.59) (146.0) Reactor Control System (Chapters 4 and 7) Method of variation of reactor power Control rods and FW temperatureControl rods Control rods and core flow
-39¬
ESBWR BWR/1 ABW Number of control rods 269 37 205 Shape of control rods Cruciform Cruciform Cruciform Pitch of control rods mm 309.88 305 309.88 (in) (12.20) (12.01) (12.20)
On the December 13, 2011 Conference Call with Safety Evaluation Review working group on the proposed Fermi 3. Mr. Michael J. Keegan, Fermi 3 Intervenor with Don’t Waste Michigan asked all Conference Call attendees: “What was the fuel enrichment level of the fuel that would be used at the proposed Fermi 3 ESBWR?”' No one in the room knew or would share the answer. Keegan further raised concerns about “Positive Void Coefficient” of the reactor after hearing discussion, asking about that potential. Again, no one in the room would or could respond to that question, but he was promised that the NRC would respond. Mr. Keegan was told that the NRC would respond to him with an answer to those questions. The NRC indicated that they had his email address of mkeeganj@comcast.net and would be responding to him.
On December 15, 2011 at the evening session of the DEIS public meeting on the proposed Fermi 3 in Monroe, Michigan, Mr. Keegan asked again what would be the fuel enrichment level of the fuel that would be used at the proposed Fermi 3. Mr. Hale, Project Manager at Fermi 3, responded, that Mr. Keegan had asked that question at a previous meeting and that the NRC would get back to him on that.
By email letter January 9, 2012, Mr. Keegan requested that Mr. Hale provide exact citations and all citations where that information could be found. Mr. Keegan informed Mr. Hale that groups that he was writing on behalf of are in legal proceedings and that information is needed in a timely manner. Mr. Hale did respond to Mr. Keegan on January 10, 2012 as follows:
-40¬
Mr. Keegan:
In response to your questions we recommend that you review the technical
information cited as follows for the ESBWR design:
1. Fuel Enrichment Levels – Refer to ESBWR DCD Tier 2 Chapter 1 Table 1.3-1
2. Positive Void Coefficients – Refer to ESBWR DCD Tier 2 Chapter 4 Sections
4.3 and 4B.3
While Intervenors appreciate Mr. Hale’s belated response, a review of his citations proves that nowhere in the Environmental Report or the DEIS is there any discussion of the potential of an accident scenario resulting from a “Positive Void Coefficient”’. With the ESBWR projected to use enriched fuel at 4.6% U-235 by weight and running at over 4500 MW thermal, and with so many firsts for this reactor design, the public can have little confidence that there are not present the dynamics for an unparalled disaster. The lack of discussion of an accident scenario encompassing the potential of “Positive Void Coefficient” has been omitted from the NEPA process. NEPA’s emphasis on “the importance of coherent and comprehensive up-front environmental analysis. . . ensure[s] informed decision-making to the end that the agency will not act on incomplete information, only to regret its decision after it is too late to correct.” Blue Mtns. Biodiversity Project v. Blackwood, 161 F.3d 1208, 1216 (9th Cir. 1998). Because critical information has been omitted from the key NEPA disclosure document, Intervenors have no opportunity to conduct their own investigation with experts in engineering, nor to comment meaningfully under NEPA.
Contention 23: The high-voltage transmission line portion of the project involves a lengthy corridor which is inadequately assessed and analyzed in the Draft Environmental Impact Statement.
The discussion of the environmental impacts to the approximately 1,000 acres of transmission corridor is deficient in a host of ways. The DEIS admits that 80 wetlands and other
-41¬
waters would be crossed by Fermi 3’s proposed, up to 300-foot wide-transmission line corridor
(Table 2-7. Page 2-46), NRC’s determination that impacts will be minimal or small is not credible. NRC’s analysis of the environmental impacts of the proposed Fermi 3 transmission line corridor is scattered throughout the DEIS, and isthus not coherent, is vague and shallow. NEPA requires a much more coherent, integrated, comprehensive, clear, and in-depth analysis. NRC’s analysis flirts with illegal segmentation for not assembling NEPA disclosures associated with the transmission corridor in its own discrete section of the DEIS.
Nowhere in the DEIS are the cumulative impacts compiled in a meaningful way. The shallow descriptions of what is planned simply do not adequately discuss the interconnectedness of the corridor land uses with adjacent land uses. For example, will the transmission line corridor, by cutting down all the trees, and dramatically increasing evaporation, completely transform a wetland into at best intermittently mucky soil? A total change might even result in eradication of virtually all wetland functions. Ephemeral wetlands, for example, are vital frog habitat. By downgrading or destroying wetlands quality, NRC’s DEIS must address the issue of whether mitigation should be considered, perhaps by creating wooded wetlands elsewhere. By not meaningfully disclosing mitigation arrangements, NRC’s DEIS violates NEPA.
The CEQ's regulations define a project's cumulative impacts as "the impact on the environment which results from the incremental impact of the action when added to other past, present, and reasonably foreseeable future actions regardless of what agency (Federal or non-Federal) or person undertakes such other actions." 40 C.F.R. § 1508.7; see also 40 C.F.R. § 1508.25 (requiring that agencies take cumulative impacts into consideration during NEPA review). The regulation states that "[c]umulative impacts can result from individually minor but
-42¬
collectively significant actions taking place over a period of time." 40 C.F.R. § 1508.7. In that vein, a consideration of cumulative impacts must also consider "[c]losely related and proposed or reasonably foreseeable actions that are related by timing or geography." Vieux Carre Prop. Owners, Residents, & Assocs., Inc. v. Pierce, 719 F.2d 1272, 1277 (5th Cir.1983). The transmis¬sion corridor is an example of this to-be-avoided piecemealing, whereby the environment suffers death by a thousand clearcuts in the shadow cast by obscurity.
The record compiled by the agency must be sufficient to determine the mitigation measures being used to compensate for adverse environmental impacts stemming from the original proposal that, unmitigated, would be significant. Spiller v. White, 352 F.3d 235, 241 (5th Cir.2003) (quoting Cabinet Mountains Wilderness v. Peterson, 685 F.2d 678, 682 (D.C.Cir.1982)). Although proposed mitigation measures need not be laid out to the finest detail, even within the more labor-intensive context of an environmental impact statement, Robertson
v. Methow Valley Citizens Council, 490 U.S. 332, 352, 109 S.Ct. 1835, 104 L.Ed.2d 351 (1989) it is still required “that mitigation be discussed in sufficient detail to ensure that environmental consequences have been fairly evaluated.” Miss. River Basin Alliance v. Westphal, 230 F.3d 170, 176-77 (5th Cir.2000) (quoting Robertson, 490 U.S. at 352, 109 S.Ct. 1835). Hence an EIS involving mitigation must include “a serious and thorough evaluation of environmental mitigation options for [a] Project to allow its analysis to fulfill NEPA's process-oriented requirements [.]” Miss. River Basin Alliance, 230 F.3d at 178.
On page 2-10, NRC admits that ITC Transmission has not yet even chosen the exact route for Fermi 3’s offsite transmission line corridor. Thus, “Detroit Edison expects that the remaining
10.8 miles [of new transmission line corridor], extending to the Milan Substation, would be built
-43¬
within an undeveloped right-of-way (ROW)…No data are available on existing land uses in the anticipated 10.8-mi undeveloped ROW segment, but the review team expects that it crosses mostly agricultural and forest lands and scattered wetlands…[and] the route likely crosses some prime farmland.” This begs the question as to why the public is being asked to comment on such a half-baked DEIS, based on a half-baked ER, based on a half-baked ESBWR design and new reactor proposal? Not knowing the corridor route effectively makes environmental impact analysis impossible. DTE should be made to disclose precisely where the transmission line corridor will be, before this proceeding continues any further. NRC cannot attempt to duck its responsibilities under NEPA by echoing DTE, that the transmission line corridor belongs to ITC Transmission (as at 2.4.1.2 Terrestrial Resources – Transmission Lines, page 2-45). This is a new atomic reactor proposal. The transmission line corridor proposal is part and parcel of the Fermi 3 proposal under NEPA.
NRC reports that “the final western 10.8 miles of transmission lines would be built in an undeveloped segment of an existing transmission ROW…Some transmission tower footings were installed there as part of earlier plans but were never used.” NRC reports that the proposed new Fermi 3 transmission line corridor would cross open water, deciduous forest, evergreen forest, mixed forest, grassland, 93.4 acres of woody wetlands, and 13 acres of emergent herbaceous wetland. (Table 2-7,Vegetative Cover Types in the Proposed 29.4-mi Transmission Corridor, page 2-46). This shows what is at stake – major impacts, or perhaps even complete destruction, to irreplaceable habitat, vital for the viability of endangered and threatened species, as well as overall ecosystem health. At 4-2, “Vegetative Cover Types Occurring in the Undeveloped 10.8-mi Segment of the Transmission Line Corridor” (page 4-28), DEIS Table 4-2
-44¬
repeats the sensitive vegetative cover forms at risk from the proposed Fermi 3 transmission
corridor: 170 acres of deciduous forest, 74 acres of woody wetlands, and 9 acres of herbaceous emergent wetlands.
Evidently earlier transmission tower footings were previously installed for no good reason whatsoever, for projects that were never completed. Those footings did environmental harm, for no good reason. Presumably, they cannot be used now as part of the current proposal, but would have to be replaced, doubling that earlier, unnecessary impact, and risking that, if and when Fermi 3 is cancelled midstream, yet more unnecessary damage will have been inflicted on vital habitat and important species. This would be the antithesis of NEPA’s purpose, to fully consider all aspects of major federal actions (such as NRC’s approval of DTE’s Fermi 3 plans) in advance, so that unnecessary damage to the environment can be avoided.
Although the NRC DEIS does mention that the platforms for the towers along the transmission line corridor will cover a relatively small area, NRC’s DEIS nonetheless does not quantify changes to wetlands. For example, how much fill will be done? How much wetland will be destroyed? Such questions must be answered, in detail, now, not later, to fulfill NEPA’s purposes under law.
NRC’s DEIS section 2.4.1.4 Important Terrestrial Species and Habitats – Transmission Lines (page 2-60) also reports the high biological stakes. Important species may occur along transmission lines, “but because the exact route of the corridor has not been finally determined, no surveys have yet been conducted to confirm the presence of any species.” Again, the risks of irreparable harm are increased due to DTE’s half-baked plans, as well as NRC’s premature DEIS. However, table 2-9 (page 2-61) shows state-listed and federally-listed species which inhabit the
-45¬
counties (Monroe, Washtenaw, Wayne) that would be crossed, including over 80 plant species, 8
insect species, 2 amphibian species, 4 reptile species (including the Eastern Fox Snake), a dozen bird species, and 2 mammal species. The Michigan Dept. of Natural Resources (MDNR/now DNRE) has not provided concurrence for the project to proceed, because DTE has provided no details about the transmission line corridor route for determining the damage that would be done to threatened and endangered species and their habitats. MDNR has identified five State-listed species likely present on the Fermi site, which could also be present along the proposed Fermi 3 transmission corridor. In addition to all of the above, the U.S. Fish and Wildlife Service has identified the eastern massasauga snake as a candidate species potentially inhabiting Washtenaw and Wayne Counties, and thus, at risk along the proposed new transmission corridor.
The DEIS refers to effects on major species. The Eastern Fox Snake is mentioned. Intervenors have raised contentions about the impacts on the endangered/threatened Eastern Fox Snake in the Fermi 3 COLA proceeding. There is valid concern that damage to, or destruction of, ephemeral and/or forested wetlands by Fermi 3’s proposed transmission line corridor will deal a fatal blow to endangered and/or threatened species, including the Eastern Fox Snake.
At page 5-22. NRC’s DEIS states (lines 22 to 32): The Endangered Species Coordinator for the Michigan Department of Natural Resources (MDNR) has not yet reviewed Detroit Edison’s proposed Habitat and Species Conservation Plan for the eastern fox snake, and has not yet commented on whether the plan’s mitigation measures would be adequate to protect the eastern fox snake (Hoving 2010). The Coordinator stated, however, that monitoring of the eastern fox snake population during and after building of Fermi 3 could help determine whether the direct impacts from increased traffic warranted additional mitigation measures. An example of mitigation for traffic mortality impacts, if needed, would be installing fences along roads to serve as barriers to the snake and reduce the likelihood of snakes being hit by vehicles. Monitoring and implementing any necessary mitigation measures, as discussed in Section 5.3.1.1, would likely hold the effects on the eastern fox snake from project operation to minimal levels. -46¬
Given the lingering doubts and uncertainties about the well being of the endangered/threatened
Eastern Fox Snake, it is essential that any negative impacts from the proposed Fermi 3 transmission line corridor be comprehensively and completely understood, so they can be prevented in the first place.
At 1.1.2 (page 1-6) Preconstruction Activities, NRC states that constructing transmission lines are preconstruction activities not needing its NEPA approval. The DEIS at page 3-22 states, “Activities associated with transmission line corridors are also considered preconstruction.” This implies an explanation for the inadequate transmission corridor analysis: the lead agency simply doesn’t care.
At 2.4.2.2 Aquatic Habitats – Transmission Lines (2-80), NRC joins DTE in a disconcerting dismissal of issues of species diversity – and the importance of the habitats on which those species depend – merely because the streams the transmission line corridor would cross are small. Also dismissed is the ecological significance of small drainages and their intermittent flows. Such habitat is vital for frogs and other critical reptilian species that serve as food for species higher up the food chain.
As reported at the DEIS at Page 2-64, the transmission lines would cross important habitats: 30 wetlands or other waters that may be regulated by the USACE and/or MDEQ, according to FWS National Wetland Inventory mapping. Several of the wetlands would require the placement of a transmission tower or pole within the wetland itself. The wetlands include woody and emergent herbaceous habitat. At 2.4.2.4, “Important Aquatic Species and Habitats – Transmission Lines” (page 2-123), NRC admits that “it is not known whether suitable habitat or populations of species identified in Table 2-16 occur in portions of the drainage that would be
-47¬
crossed by the proposed transmission route. The FWS and MDEQ may require surveys of the
proposed transmission line corridor to evaluate the presence of important species and habitat.” Again, this is evidence that NRC’s DEIS, as with DTE’s ER and COLA, is premature. Table 2-16 shows what is at stake. The listed federal and state species include 16 species of mollusks, and 17 species of fish (pages 2-99 to 2-100).
There is no discussion in the DEIS of whether the wetlands in the transmission corridor are connected to close-by wetlands, themselves not under power lines or impacted by other human activities, and what effect denuding the forested wetlands of trees in the transmission corridor will have on overall wetland units in the ecosystem, such as “greenways” for species movement and hence genetic diversity. There is no clear, long-term management plan articulated in the DEIS. It is clear that the deforestation will be an indefinitely long, or even permanent, condition. Although herbicides designed for use in wetlands are mentioned, no specifics are given. The impact of these biocides on species inhabiting the corridor is thus impossible to analyze, given the lack of specificity. The downgrade in the ecological quality and quantity (or even permanent loss and complete destruction) of forested wetlands in an extended area along the Fermi 3 transmission line corridor is a major ecosystem impact, which currently goes unreflected. For example, at Wetlands and Floodplains (page 5-24), NRC states:
Vegetation management actions may include, but are not limited to, pruning, wall trimming, tree removal, mowing, and herbicide application…Wetlands within the corridor that have the potential to regenerate in forest vegetation are expected to be manually cleared of woody vegetation periodically for line safety clearance, thereby being kept in a low-growing scrub/shrub or emergent wetland state…Detroit Edison expects that ITC Transmission would minimize the use of pesticides in wetland portions of the transmission corridor (Detroit Edison 2010b).
Thus, the damage appears to be permanent. Detroit Edison “expects,” but is not certain, that
-48¬
pesticide usage would be minimized. The permanence of the damage is again documented at
4.1.2, “Transmission Line Corridors and Other Offsite Facilities:” “…in forested areas, the corridor would remain cleared.” (page 4-8).
At page 2-47, “Existing Natural and Human-Induced Ecological Effects on the Transmission Corridor”, NRC admits “Corridor maintenance, including the removal of undesirable vegetation by mechanical means and herbicides, imposes stress on terrestrial resources.” But vegetation is desirable from a habitat and biological diversity perspective. The proposed Fermi 3 transmission corridor will inflict permanent damage on habitat, such as wetlands and forest, vital for protecting and preserving biological diversity, such as the survival of threatened and endangered species. The permanence of this destruction of habitat is docu¬mented at 3.4.2.2 Power Transmission System (page 3-31): “During operation of Fermi 3, the power transmission line system would need to be maintained free of vegetation by ITC Transmission. Vegetation removal activities would include trimming and application of herbicides periodically and on an as-needed basis along the transmission line corridor.”
At 3.3.1.8, “Transmission Line Corridors” (page 3-26), NRC admits that:
Installing transmission lines would require the removal of trees and shrubs along portions of the transmission line corridor, movement of construction equipment, and shallow excavation for the foundations of the transmission line towers… The 10.8 mi corridor to the Milan substation is currently undeveloped, and building this portion of the line could disturb 393 ac of mostly forested and agricultural lands. A total of 1069 ac of
land would be occupied by the 29.4 mi long transmission line corridor. There is no commitment documented in NRC’s DEIS that DTE and/or ITC Transmission will use the best available science in assessing damage and management planning along its proposed Fermi 3 transmission line corridor. There is also little to no discussion of best available science or best available technology to prevent or mitigate ecological harm caused by the proposed new
-49¬
transmission line corridor.
Any inventory of the loss of wetlands functions due to damage done by the Fermi 3 transmission corridor is woefully inadequate, disjointed, and largely non-existent. These impacts on the ecosystem represent a significant change in the character of wetlands habitat, which is not captured by the DEIS.
An ironic part of the Fermi 3 transmission line corridor proposal is the plan to destroy restored prairie at/near the Fermi site. At 3.3.1.9, “Switchyard” (page 3-26), NRC reports: “Detroit Edison would build a new switchyard containing three 345-kV transmission lines to transport to (sic) power generated by Fermi 3. The Fermi 3 switchyard would be constructed on 10 ac of the prairie restoration area at the intersection of Fermi Drive and Toll Road (shown as “28” on Figure 3-2). The irony is that DTE often brags about its ecological “good citizenship,” such as “nature preserves” it has established. For example, at both the NRC environmental scoping public meeting in January 2009, and again at the NRC DEIS public comment meeting in December 2011, DTE set up a large, glossy “informational display” in the lobby about its efforts to preserve and protect the environment in the Fermi plant vicinity. But this is mere PR green-washing, belied by DTE’s readiness to destroy restored prairie to build a switchyard for Fermi 3. TheDEIS does not disclose why the prairie was restored in the first place, nor what the history was that prompted DTE to preserve/restore it. If it were to mitigate other ecological destruction associated with the Fermi nuclear plant, DTE in its ER, and NRC in its EIS, surely must disclose those facts, as well as relevant laws, regulations, and commitments made to local, state, and/or federal government agencies.
NRC is required in its DEIS to describe in detail permits that are required, including
-50¬
CWA 404 and Michigan state laws. State-required permits are needed since Michigan is deputized to enforce the Clean Water Act on inland wetland areas. Sufficient detail is missing currently from NRC’s DEIS on these legal and regulatory matters.
The DEIS, at 2.7.3, “Historic and Cultural Resources within the Transmission Line Corridor,” (page 2-205), raises social and environmental justice, as well as human rights and religious freedom issues. Also implicated are various treaty rights, established by treaties signed between the U.S. federal government and various Native American nations. These treaties, after all, are the highest law of the land, equal in stature to the U.S. Constitution itself. At page 2-206, again reflecting the premature nature of the DEIS, as well as the half-baked nature of the Fermi 3 proposal writ large (including its proposed new transmission corridor), NRC admits that “Efforts to identify cultural resources along the proposed transmission line route were limited…” Hence, culturally significant sites could be bulldozed by DTE and ITC Transmission for the Fermi 3 transmission line corridor, without the public or affected Native nations even knowing that culturally significant sites were at risk.
Table 2-63 on page 2-206 shows that the proposed new segment of the transmission line corridor would impact five “archaeological” or “prehistoric” sites, three of which are of uniden¬tified prehistorical significance, two of which are identified as Late Woodland, and one of which is identified as Woodland. Given the lack of adequate NRC outreach and government to govern¬ment consultation with affected units of Indian government, NRC’s determination that these impacted sites are insignificant is entirely inappropriate. Affected tribal governments should be contacted, and allowed to determine for themselves the significance of these identified sites. To do otherwise in the year 2011 is entirely unacceptable, given the religious significance of burial
-51¬
and other sacred sites to Native American Nations, for instance, as protected under law.
Compliance with the National Historic Preservation Act does not preclude the need to comply with NEPA with regard to impacts on historic and cultural aspects of the environment. Therefore, impacts on proposed historic districts must be evaluated and, if necessary, mitigation measures undertaken. Philadelphia Electric Co. (Limerick Generating Station, Units 1 & 2), LBP-83-11, 17 NRC 413, 435 (1983). See also Hydro Resources, Inc., LBP-05-26, 62 NRC 442, 472 (2005) (To comply with NEPA in this regard, “an agency must reasonably (1) consider the historic and cultural resources in the affected area; (2) assess the impact of the proposed action, and reasonable alternatives to that action, on cultural resources; (3) disseminate the relevant facts and assessments for public comment; and (4) respond to legitimate concerns.”).
Contention 24: The public health effects and impacts from routine, licensed radiological emissions in air and water from the proposed Fermi 3 have been inadequately assessed, analyzed and disclosed in the Draft Environmental Impact Statement, in violation of NEPA.
About a quarter mile downstream of the Fermi 3 the cooling water intake and discharge pipe facilities planned for construction are two public water supply intakes on Lake Erie: the Frenchtown Water Plant, which uses 8 million gallons per day (MGD), and the Monroe County Water Plant, which uses 7.5 MGD (Frenchtown Charter Township 2010; AWWA 2009). The impacts of these two water plants and the other projects listed in Table 7-1 of the DEIS are considered in the analysis in Sections 4.2 and 5.2 and would not be detectable or would be so minor that they would not affect surface water use.
Because the chemical contents of the water vapor emitted from the cooling towers is unknown, there is a consequent omission to analyze the environmental impact of the contents of
-52¬
the water vapor emitted from the cooling towers. The environmental impact cannot be assessed if the chemical content of the drift from the towers is unknown. The total dissolved solids in the
drift water were assumed to be salt (see pages 5-18, 5-91, 5-138 of the Fermi 3 DEIS). Such an assumption does not constitute a science-based analysis of the actual conditions and completely
fails to consider the impact of other chemicals in the drift, many of which could be far more environmentally destructive than salt and could appreciably contribute to the PM2.5 emissions
from the cooling towers. On page 7-13 DEIS Fermi 3, there is a brief discussion of the industrial pollutants that are acknowledged to be in the waters of Lake Erie. However, the rest of the
document assumes that these pollutants do not exist and does not address their potential environmental impact as cooling tower drift.
In the DEIS, the discussion of population dose of radiation includes the following passage:
5.9.3.2 Population Dose Detroit Edison estimated the collective total body dose within a 50-mi radius of the Fermi 3 site to be 14.9 person-rem from liquid effluents (Detroit Edison 2011a) and
6.7 person-rem/yr from gaseous effluents (Detroit Edison 2011a). The estimated collective dose to the same population from natural background radiation is estimated to be 2,400,000 person-rem/yr. The dose from natural background radiation was calculated by multiplying the 50-mi population estimate for 2060 of approximately 7,710,000 people by the annual background dose rate of 311 mrem/yr (NCRP 2009).
The collective dose from the gaseous and liquid effluent pathways was estimated by using the GASPAR II and LADTAP II computer codes, respectively. The staff performed an independent evaluation of population doses and obtained similar results
(see Appendix G).
Radiation protection experts conservatively assume that any amount of radiation may pose some risk of causing cancer or a severe hereditary effect and that the risk is higher for higher radiation exposures. Therefore, a linear, no-threshold dose response relationship is used to describe the relationship between radiation dose and detriments, such as cancer induction. The recent BEIR VII report by the National Research Council (2006) reconfirms the linear, no threshold dose response model. Simply stated, any increase in dose, no matter how small, results in an incremental increase in health risk.
-53¬
(Emphasis supplied). Intervenors’ expert, Joseph Mangano, MPH/MBA, whose declaration, report and curriculum vitae are attached and incorporated by reference, has provided his own calculations and assessement of epidemiological consequences from the 25-year operation history of Fermi 2. There are statistically noteworthy increases in the rate of all major types of cancer, coinciding with the period just after Fermi 2 went into full-scale operation, and also, the rates of hospitalization for cancers, benign neoplasms and congenital anomalies. While Mangano’s conclusion is that statistically it would be difficult to anticipate what the specific effects of another operational nuclear power plant would be, he states:
...[B]asic data on the performance of Fermi 2 places great doubt about whether Fermi 3 will pose a safety and health risk for local residents. Accordingly, the conclusion of this report is that no decision should be made on whether or not to approve a license for Fermi 3 until more research of this type is undertaken; a thorough public education and discussion process occurs; and that the majority of local people still approve of the new reactor with this additional knowledge.
CONCLUSION
A petitioner does not have to prove its contentions at the admissibility stage. Private Fuel Storage, L.L.C. (Independent Spent Fuel Storage Installation), CLI-04-22, 60 NRC 125, 139 (2004). The factual support required is “a minimal showing that material facts are in dispute.” All that is needed at this juncture is “alleged facts” and the factual support “need not be in affidavit or formal evidentiary form and need not be of the quality necessary to withstand a summary disposition motion.” First Energy Nuclear Operating Company (Davis-Besse Nuclear Power Station, Unit 1), ASLBP No. 11-907-01-LR-BD01, LBP-11-13 at 17 (April 26, 2011) (slip op.). Intervenors have made more than a minimal showing as to each of the foregoing contentions, and therefore pray the Licensing Board admit each one for adjudication.
-54¬
/s/ Terry J. Lodge Terry J. Lodge (OH #0029271) 316 N. Michigan St., Ste. 520 Toledo, OH 43604-5627
(419) 255-7552 Fax (419) 255-7552 Tjlodge50@yahoo.com Counsel for Intervenors
-55¬
January 11, 2012
UNITED STATES OF AMERICA NUCLEAR REGULATORY COMMISSION
Before the Atomic Safety and Licensing Board
In the Matter of ) Docket No. 52-033
The Detroit Edison Company ) (Fermi Nuclear Power Plant, Unit 3)
*****
CERTIFICATE OF SERVICE
I hereby certify that copies of the foregoing “MOTION FOR RESUBMISSION OF CONTENTION 10, TO AMEND/RESUBMIT CONTENTION 13, AND FOR SUBMISSION OF NEW CONTENTIONS 17 THROUGH 24” have been served on the following persons via Electronic Information Exchange this 11th day of January, 2012:
Ronald M. Spritzer, Chair Michael F. Kennedy Administrative Judge Administrative Judge Atomic Safety and Licensing Atomic Safety and Licensing Board Panel Board Panel Mail Stop: T-3F23 Mail Stop: T-3F23
U.S. Nuclear Regulatory U.S. Nuclear Regulatory Commission Commission Washington, DC 20555-0001 Washington, DC 20555-0001 E-mail: Ronald.Spritzer@nrc.gov E-mail: Michael.Kennedy@nrc.gov Office of Commission Appellate Office of the Secretary Adjudication ATTN: Docketing and Service Mail Stop O-16C1 Mail Stop: O-16C1
U.S. Nuclear Regulatory U.S. Nuclear Regulatory Commission Commission Washington, DC 20555-0001 Washington, DC 20555-0001 E-mail:OCAAmail@nrc.gov E-mail: HEARINGDOCKET@nrc.gov
-56¬-57¬
The Great Lakes Environmental Law Center
Protecting the world’s greatest freshwater resource
and the communities that depend upon it
440 Burroughs Street, Box 70 Detroit, Michigan 48202
www.glelc.org
January 11, 2012
Chief, Rules, Announcements, and Directives Branch Office of Administration Mail Stop: TWB-05-B01M
U.S. Nuclear Regulatory Commission Washington, DC 20555-0001
Re: Draft Environmental Impact Statement/Environmental Impact Report for the Combined License (COL) for Enrico Fermi Unit 3, NUREG-2105, Vol. 1
On behalf of the Great Lakes Environmental Law Center (GLELC), thank you for the opportunity to review and comment on the Draft Environmental Impact Statement (DEIS) for the Combined License (COL) of the proposed Unit 3 (Fermi 3) of the Detroit Edison Enrico Fermi Power Plant in Monroe County, Michigan. The GLELC is a Detroit-based nonprofit organization
founded to protect the world’s greatest freshwater resource and the communities that depend
upon it.
Detroit Edison (Edison) proposes to construct and operate a new power reactor unit at the Detroit Edison Enrico Fermi Atomic Power Plant site in Monroe County, Michigan. This project would include “hydrological alterations to Lake Erie from operation of Fermi 3” including “increased water use, discharge of cooling water, and maintenance dredging of the intake canal.” DEIS at 5¬
6. These proposed actions require approval from both the Nuclear Regulatory Commission (NRC) as well as permit approval from the U.S. Army Corps of Engineers (USACE) to perform certain construction activities on the site. As a result, the USACE and NRC prepared this DEIS as cooperating agencies and participated collaboratively as a review team. In reviewing the proposed construction and operations, the reviewing agencies analyzed the proposed project’s environmental effects to ensure compliance with a number of statutes, policies, and regulations, most notably the Great Lakes Compact, Michigan Water Quality Standards, and the Michigan Natural Resources and Environmental Protection Act of 1994.
The GLELC has focused its review of the DEIS on issue areas central to the long-term health of the Great Lakes, as well as the communities and wildlife that depend upon the ecosystem. The GLELC has serious concerns about the adequacy of the DEIS, particularly with respect to the document’s analysis of the effects of thermal pollution, consumptive water use, wetlands
degradation, and wildlife depletion. These inadequacies need to be addressed before further
action on the proposed project.
Consumptive Water Use Issues
The DEIS analyzes the effect of the project on the adjacent bodies of water in a number of its sections, including water consumption. Although there are impacts to groundwater and adjacent streams in the construction of Fermi 3, “the primary water body of concern is Lake Erie, which would be the sole source of water to Fermi 3 and would receive the majority of the discharged from Fermi 3.” DEIS at 2-26. Thus, the primary concern of the reviewing agencies should also be on the effect of the Fermi 3 operations on Lake Erie.
With Lake Erie under increasing stress from various uses and interests, and tensions increasing due to the presence of so many different interests and actors trying to manage one large hydrologic system, the various states and provinces created and ratified the Great Lakes Compact
in 2008 as a framework to “act together to protect, conserve, restore, improve and effectively
manage the Waters and Water Dependent Natural Resources of the Basin under appropriate
arrangements for intergovernmental cooperation and consultation.” Great Lakes Compact §
1.3(2)(a). Within this framework the states created a system by which all actors attempting to withdraw or consume large amounts water from the Great Lakes must seek approval from the various state actors that are party to the agreement. The review team accurately cites this
approval requirement with the DEIS, stating that “with the passing of the Great Lakes Compact
in 2008, any new water withdrawals within the Great Lakes Basin that would result in a consumptive use of 5 MGD [million gallons per day] or more were made subject to review by all of the States and provinces in the region.” DEIS at 2-25. This requirement, however, is merely mentioned within a single section and is not properly addressed by the DEIS.
With an estimated consumptive footprint of 20-25 million gallons per day, the Fermi 3 facility will most certainly be subject to a “regional review” from the various states and provinces within the Compact. Id. at 5-8. The review by the states and provinces will likely require voluminous information from Detroit Edison in order to gain approval from the Parties for their desired levels of withdrawal and consumption. Great Lakes Compact § 4.3. Each party will be able to review whether Edison’s proposed usage is consistent with the Compact based on a number of factors, most notably whether “withdrawal or consumptive use will be implemented so as to ensure that the Proposal will result in no significant individual or cumulative adverse impacts to the quantity or quality of the Waters and Water Dependent Natural Resources and the applicable Source Watershed” and whether “the withdrawal or consumptive use will be implemented so as to incorporate Environmentally Sound and Economically Feasible Water Conservation Measures.” Great Lakes Compact § 4.11. Based on the statistics given within the DEIS, Edison and the reviewing agencies will likely find that standard difficult to meet.
The DEIS states that the Fermi 3 facility will withdraw around 50 MGD of water, and consume about half that; 20-25 MGD. DEIS at 5-8. In comparison, the reviewing agencies note that “between 2000 and 2006, the US and Canadian power plants withdrew an average of 168 MGD from Lake Erie and consumed an average of 14 MGD, amounting to an average consumption
rate of 8%.” Id. at 2-23. Fermi 2, which accounted for about half of that average daily
withdrawal for the entire lake, had a consumption rate of about 40%, far higher than other facilities. Id. Therefore, the proposed Fermi 3 facility, while withdrawing less water than its counterpart Fermi 2, will actually consume a great deal more water. In fact, the Fermi 3 plant will consume far more water per day than all of the nuclear facilities on Lake Erie combined on average from 2000-2006. Id. at 2-23.
The review team states in the DEIS that an estimated annual consumption of 7.6 billion gallons of water would only amount to about 4% of the current total consumptive use of Lake Erie, dismissing this percentage as a small impact and concluding that mitigation is not warranted. Id. at 5-8, 5-9. With this new facility estimated to take up such a large amount of consumptive use in comparison to its peer facilities and industrial use as a whole, the Party states to the Compact may not agree with the reviewing agencies under the standard of review set forth in the Great Lakes Compact, and find the use per se unreasonable. When looking at the long-term health of the Great Lakes Basin, the Party states are likely to note that climate change could put increasing pressure on the lake as water levels decrease and consumption from all sectors increases. The DEIS notes that “potential increases in Lake Erie water temperature resulting from climate change could increase the amount of cooling water needed for operation of the proposed Fermi 3 and other major users. Therefore, the operations of Fermi and other thermoelectric plants on Lake Erie could be altered as a result of climate change.” Id. at 7-10, 7-11.
Because of the uncertainty inherent in gaining approval from the regional review process under the Great Lakes Compact for a project this size, the GLELC recommends certain actions by the applicant and the reviewing agencies. First, steps should be taken to initiate an approval process under the terms of the Great Lakes Compact. Perhaps by noting the Compact review requirement in the DEIS without addressing it, the review team understands the requirements of the Compact to be separate from those that need to be outlined in an EIS process; it may in fact be an operational issue and not a construction issue, for example. However, it is clear that an approval through the regional review process of the Compact is necessary in order for the Fermi 3 facility to operate. Second, the reviewing agencies should include in the Final EIS the steps that will be taken by the relevant parties to seek and gain approval by the parties of the Compact. Included in
these steps should be an explanation of why the Fermi 3 facility’s large consumptive use of
water, in comparison to its counterpart facility Fermi 2 as well as other peer facilities in the region, should be allowed in accordance with the principles of the Great Lakes Compact.
Thermal Pollution Impacts
Similar to its analysis with respect to consumptive use issues, the DEIS notes the issues with thermal pollution on its discharge cooling water into Lake Erie but does not properly evaluate these issues as serious and fails to provide potential mitigation options for the Fermi 3 facility. As the review team is well aware, Lake Erie is under a number of stresses, and in particular the stress caused by warmer temperatures has lead to historically bad algae blooms that create a toxic environment for much of the natural aquatic flora and fauna. The review team notes this, stating that “current water quality concerns with regard to Lake Erie include (1) increased phosphorus loading from regional agricultural activities, which cause toxic algal blooms.” DEIS at 2-26. Additionally, the reviewing agencies also determined through sampling that area of lake adjacent to Fermi 3 was consistent with other stressed areas of the lake, with “elevated levels of nutrients including total phosphorus, orthophosphorus, nitrate and nitrite nitrogen, and total Kjeldahl nitrogen.” Id. at 2-28. An increase of localized temperature caused by a large and steady discharge of cooling water could therefore have a deleterious effect on Lake Erie’s ability to regulate its own toxicity. Nonetheless, the reviewing agencies determined that thermal pollution potentially caused by the Fermi 3 facility would have a minimal impact on Lake Erie, and did not recommend any mitigation strategies for Edison.
In determining the possible impact of thermal pollution, the DEIS looks to the Michigan Water Quality Standards, which include temperature limits for Lake Erie, including mixing zone limits
and applicability of the standards. These regulations state that the “Great Lakes and connecting
waters shall not receive a heat load which would warm the receiving water at the edge of the mixing zone more than 3 degrees Fahrenheit above the existing natural water temperature.” MI Admin. R. 323.1070(1). Based on Lake Erie’s mean monthly temperature, the regulations give specific heat limits over which, if occurring outside of a designated mixing zone area, the temperature becomes a thermal plume. DEIS at 5-11. Approval of the size of the mixing zone varies depending on the size of the thermal plume and the body of water and is determined in the discharge permitting process, which has yet to occur. MI Admin. R. 323.1082(4).
To investigate the potential impacts of discharged cooling water with elevated temperatures on Lake Erie, Detroit Edison used a hydrodynamic model that simulates mixing processes, to evaluate the average impact and size of discharged thermal plumes. DEIS at 5-12. Based on the simulations performed under this modeling framework, Edison found that in 9 of 12 months each year, the average temperature of the potential thermal plume will be above the maximum temperature allowed under Michigan regulations. Id. Additionally, in three months out of the year, the difference between the mean temperature of the discharge and the mean ambient lake temperature will be over 20 degrees Fahrenheit. Id. Important to note within these results is that they measure mean temperature differences, which indicates that in many instances throughout the month the temperature differences will be even larger.
Noting that the thermal plume would not be large enough to reach the shoreline (primarily due to the lengthy discharge pipe called for in the design of the facility), and enormous size of the basin into which the thermal plume would be discharged, the reviewing agencies determined that the thermal pollution would have minimal environmental impact on Lake Erie and did not suggest mitigation or alternatives to the current discharge plan. Id. at 5-7; 5-16. This analysis is poorly framed, particularly when future projections which factor in the impact of climate change are taken into account.
The projections based on Edison’s simulations show a thermal plume that could potentially be as large as 55,000 square feet. DEIS at 5-2; 7-14. While this plume is a “small fraction of the western basin of Lake Erie,” at a localized level it could be enormously damaging, especially if the temperatures are upwards of 20 degrees Fahrenheit warmer than the mean natural temperature of the lake. This thermal pollution could result in drastic growth of toxic algae, heat
stress for aquatic life, and, as the DEIS states, “the creation of favorable conditions for invasive species.” Id. at 5-33. Furthermore, in their analysis of possible impacts, the reviewing agencies indicate that climate change could exacerbate the issues caused by thermal plumes. Climate
change could lower lake levels, causing large thermal plumes and mixing zones caused by the
shallow depths at the area of discharge (already as low as 7 feet in some areas) to expand further. Id. at 7-14. Additionally, as previously noted, higher average lake temperatures would lead to greater water withdrawals to achieve the same cooling effectiveness. The larger withdrawals would also lead to larger discharges, which could create even larger thermal plumes at the shallower depths. Id. at 7-11; 7-14.
The GLELC recommends that the reviewing agencies reevaluate the potential problems caused by thermal pollution from coolant water discharges at a more localized level before producing the Final EIS. The review team did suggest two mitigation procedures within the DEIS, the installation of a diffuser that would mix the discharge before being released into the lake and a procedure to gradually reduce the discharge of cooling water during plant shutdowns to avoid any sort or heat or cold shock to aquatic species. DEIS at 5-7; 5-35. These are positive mitigation procedures but not adequate to properly address the extent of harm that the volume of warm effluent being released by the facility. It should be noted that, as the Great Lakes Compact monitors both consumption and withdrawals, the discharge of thermal pollution as a result of a withdrawal would also be subject to a review under § 4.11 of the Compact. Therefore, it would be prudent for both Edison and the regulatory agencies tasked with approving Fermi 3 to ensure that the thermal plumes being discharged into Lake Erie “result in no significant individual or cumulative adverse impacts to the quantity or quality of the Waters and Water Dependent Natural Resources and the applicable Source Watershed.” Great Lakes Compact § 4.11.
Wetlands & Wildlife Impacts
The evaluation of the wetland areas that would be impacted by the construction and operation of the reactor, and the potential status of selected wildlife within those areas is not fully and properly addressed in the DEIS. The majority of the Fermi site, which includes Fermi 3 as well as the currently operating Fermi 2, is currently characterized as surface wetlands within the coastal zone of Lake Erie. DEIS at 2-13; 2-14. Approximately 656 acres of undeveloped lands on the Fermi site are managed as part of the Detroit River International Wildlife Refuge. Id. at 2-14. Wetlands are a unique habitat and provide a number of different benefits to human society and the environment, and thus they are protected by both state and federal laws requiring permits from both state and federal agencies. Id. at 2-53. In this case, the wetlands on the Fermi site are particularly valuable in shielding the area from flooding, as well as providing habitat for a number of species. Id. at 2-57; 2-58.
Between the construction and operation of the Fermi 3 facility, about 19 of the 656 acres of coastal wetlands would be permanently converted. Id. at 5-23. Additionally, the new facility will require some auxiliary support structures, transmission lines, and vehicular access roads, making up a transmission corridor travelling to the edge of the Fermi site that will further cause temporary destruction or soil erosion in another 93.4 acres of inland wetlands. Id. at 5-39; 7-21. Edison has already submitted a Joint Permit Application to both the MDEQ and USACE in order to fill these wetlands as part of construction. Within the DEIS, the reviewing agencies determined that mitigation was necessary and would be performed through 82 acres of coastal
wetland restoration at an offsite location on Lake Erie as well as 21 acres of onsite restoration as
proposed by Edison within their 404 permit. Id. at 7-20.
The GLELC believes this mitigation plan is bereft of details within the pages of the DEIS. Further investigation into communications between the USACE and Edison reveal that as of December 2011, the USACE had still not verified the adequacy of the applicant’s avoidance and minimization statement, and therefore its compensatory mitigation plan. U.S. Army Corps of Engineers Public Notice Re: Application of Detroit Edison No. LRE-2008-00443-1-S11 at 5. The Federal Regulations state that compensatory mitigation may only be employed after all appropriate and practical steps to avoid and minimize adverse impacts to aquatic resources, including wetlands and streams, have been taken. 33 CFR 325 et seq. The USACE needs to confirm both the necessary conversion of the wetlands on site as well as the proposed mitigation from the 404 application if it is to move forward properly. The EIS should also include proposed mitigation measures that take the potential effects of climate change on the wetland areas into account. Prolonged higher temperatures could cause increased evaporation rates, which, along with the greater likelihood of drought, could reduce the extent of wetlands in the area.” Id. at 7¬
18.
In analyzing the effect of possible conversion of wetlands in the DEIS, the review team noted that there were possible threatened species that may be effected by the elimination of wetlands, and more specifically, by the creation of infrastructure and access roads within the wetlands. The DEIS noted first, that the creation of access roads creates a moderate threat to the status of the Eastern Fox Snake, listed by the State of Michigan as Threatened, due to possible vehicle mortality. DEIS at 5-142; 7-16. The DEIS also reported a potential impact to the American Lotus, also listed by the State as Threatened, due to construction activities. Id. at 7-20. In both cases the regulatory agencies made note that Edison would work together with the Michigan Department of Natural Resources to create protections for those Threatened species. No specific protection plans are in place at this time however, and these protections must be published and available for public comments prior to inclusion in the Final EIS.
The impact of thermal pollution on local aquatic wildlife was discussed in the previous section, but likewise, thermal pollution is another issue associated with the operations of the Fermi 3 facility with potential for increasing harm to wetlands and wildlife as climate change continues to alter lake levels and temperatures.
Conclusion
The Final EIS must fully assess the proposed project’s potential impacts on Lake Erie as well as wetlands and wildlife impacts. We also encourage the applicant, in collaboration with the NRC and USACE, to begin taking steps to gain approval of their proposed water usage under the Great Lakes Compact.
The DEIS contains a significant body of data, but Detroit Edison and the reviewing agencies were too quick to conclude issues associated with thermal pollution and water consumption as minor, when in fact they are very significant. The GLELC encourages the NRC and the USACE to perform further analysis of available data and collecting additional data where existing data is insufficient to reasonably assess potential impacts and risks to water quantity, water quality, wetlands and wildlife. Finally, the GLELC supports the continued collection of data and information, including that associated with the USACE assessment of Edison’s proposed mitigation project attached to their 404 permit application, so that current and new biologically significant impacts are identified and appropriately analyzed.
The National Environmental Policy Act analysis does not require that a specific decision be made, but it does require specific steps to be taken prior to the making of a decision. In order to comply with NEPA, we request that the NRC evaluate the impacts from consumptive water use, thermal pollution, impacts on wetlands and wildlife, as well as potential impacts from climate change and cumulative impacts to Lake Erie, as outlined above, to address the inadequacies found within the DEIS.
Thank you for the opportunity to comment and for considering our views.
Nick Schroeck Executive Director Great Lakes Environmental Law Center 440 Burroughs St. Box 70 Detroit, MI 48202
(313) 820-7797 nschroeck@wayne.edu
Fermi 3: A Critique of the Resource Options Comparing Fermi 3 to Efficiency and Renewable Generation
Ned Ford, Consultant to the Sierra Club
January 11, 2012
Detroit Edison proposes to build a nominal 1600 MW nuclear plant at the existing Fermi site, named Fermi 3. The proposed plant would produce 1535 MW’s of net generating capacity.
Should this plant operate at 90% capacity factor, a level which is often stated as a reasonable value for the function of a new nuclear plant, it would generate 12,108,847 MWH’s per year.This would represent 29.7% of Detroit Edison’s 2010 sales.
However, based on our review of available data, Michigan’s nuclear fleet operates at a mere 66% capacity factor. While this may be due to economic sales opportunities and a poor fit between Michigan’s general consumption pattern and nuclear generation rather than poor operation of the plants in question it creates an overwhelming burden of proof that a new nuclear plant which is massive relative to the proposing utility will not create an unacceptable negative economic impact. It may be possible for Detroit Edison to show that its operation of Fermi II has a better track record, but the recent years do not give that suggestion much support.
Since Michigan’s overall electric industry has a similarly low capacity factor it is extremely likely that Michigan and Detroit Edison have a “needle peak” problem, meaning that more than twenty or thirty percent of its peak MW demand level exists for less than ten percent of the year.
This presentation challenges the appropriateness of the Fermi 3 proposal on economic grounds, by comparing it on several terms with available clean energy alternatives. Natural gas is not clean energy, but it is regarded as very important these days. It will be discussed briefly, and shown to have important limitations.
To address a low capacity factor or “needle peak”, the lowest cost option is efficiency, which can easily be oriented to address peak demand (high efficiency commercial lighting and all air conditioning efficiency and all refrigerator efficiency in air-conditioned space will have high impact on demand). Load management programs are considered to be similarly inexpensive, but there may be limits on the level of participation which is available at low cost when real curtailment of service is required.
One of the key issues in comparing Fermi 3 to alternatives is the current pace of price shifts. During the last ten years the cost of new coal plants has increased three to four times. The cost of new natural gas plants has increased nearly that much. The cost of wind turbines has more than doubled (although it has dropped 30% in the last three years), and the cost of a new nuclear plant remains speculative, but is unquestionably at least three or four times as much as it was the last time a nuclear plant was completed in the United States. By contrast, efficiency has held pretty steady in cost over thirty years, gaining ground through better technologies and the rising value of the savings. In other words, the cost of efficiency has held steady, while the efficiency potential has increased faster than U.S. citizens and businesses have installed the technologies. Photovoltaics have fallen almost ten percent in price per year for almost twenty years, and are cheaper than new natural gas in the Southwest U.S. The same cost/benefit can be expected in three to five years in the Midwest, due to our lower sunlight index.
Since the value of wind and photovoltaic technology is a function of the available wind or solar resource as well as the equipment, there is a real revolution in U.S. electric technology under way. In 2011 the price of electricity from a new wind turbine became unequivocally cheaper than any new fossil resource generation in most of the U.S. With the wind production tax credit, new wind costs less than four cents per KWH in many states with good wind resources. The wind production tax credit is under fire, but in 2011, the tax credit was 2.11 cents per KWH, while the cost of coal per KWH was 2.35 cents, so the tax credit pays for itself.
Similarly photovoltaics are crossing paths with fossil and nuclear options. In the Southwest U.S. where solar resources are better than across the Midwest, photovoltaics are deemed cheaper than natural gas by several State regulatory orders. Following the long term trend of price reductions, photovoltaics are likely to become cheaper than new coal in the Midwest in three to five years. When the current market price of photovoltaics is compared to the marginal cost of peak energy in summer peaking utilities, it is already cheaper than existing supply in most places. Since this analysis is not consistently performed in utility planning, there is a huge potential relative to the current size of the photovoltaic market in nearly all of the U.S. Even if the peaking service which is cost-effective today is small compared to total U.S. consumption, meeting it will drive the price of the technologies even lower, and make a much larger fraction of the market cost-effective from PV. This isn’t theory. It is what is happening today.
Comparing all these factors is challenging. The biggest uncertainty is the price of a new nuclear plant. Estimates range from $6,000 to $12,000 per KW of capacity. But even if this amount were fixed, it understates the cost of a plant which takes ten to twelve years to construct. Engineering costs, which must be expended before ground is broken, can be thirty to forty percent of the plant cost, but accrue interest and carrying charges for the eight or nine years during which the plant is under construction, as does much of the early heavy construction itself. And then once the plant is completed the unamortized debt continues to accrue interest and carrying costs. Although these are factored into rates and do not increase the unpaid balance of the plant cost, they extend the amortization period substantially. Like a home mortgage carried to completion after thirty years, the new power plant will actually cost two to three times its initial “price”.
By contrast, efficiency, wind and photovoltaics are added incrementally, and in today’s world are more often financed by independent power producers. They have nearly fixed operation and maintenance costs and zero fuel price uncertainty. These carry real and important long term economic value which is obscured by the practice of calculating “net present value” of investments with varying timeframes. “Net Present Value” calculation diminishes the future cost or future benefits of a given choice by adjusting the future year price for interest and inflation. It tends to discount everything beyond twelve or fifteen years as having zero value. Net Present Value calculations are useful when applied thoughtfully and correctly. They are often applied without full consideration of the future value of real future economic benefits. For example, the value of superinsulation in a new home is considered not to exist after twelve to fifteen years. Yet the value of that insulation in thirty or forty or fifty years is not only significant, but it can easily exceed the entire cost of the initial application each year, for the life of the structure, due to the known and predictable inflation of fuel costs.
Southeast Michigan’s electricity future is uncertain, highly variable, and promises some tremendous economic benefits if options are kept open to the rising wave of cheap clean energy. Fermi 3 is a good choice for only one very specific, very rigid, and increasingly unlikely possible future. Even that possible future won’t favor Fermi 3 if the cost of the plant rises too high.
The Death Spiral:
In the 1980’s a number of nuclear plants were completed after having exceeded initial cost predictions by multiple times. Utilities discovered the “death spiral”, which was the point, around 14 to 15 cents per KWH, where it became impossible to raise revenues by raising rates. Customer conservation was and is induced by high electricity costs. While one might hypothesize that the trigger point has risen due to inflation, it is more likely that the present trend of electricity consumption in Michigan is evidence that it has lowered due to economic pressures from other factors.
One important aspect of this is that a nuclear plant project, even with Federally backed loan guarantees, cannot make a profit for its owners if it cannot sell power into the wholesale market, unless a regulatory or legislative mandate is made to force ratepayers to take power above the market rate. The cost of nuclear power is highly debated, and highly speculative, especially because of the lack of real life experience in the United States during the last quarter century. Many references suggest that a nuclear power plant which has an “overnight” cost of $6,000 per KW can sell power at slightly more than six cents per KWH. That general set of assumptions is used widely in industry “levelized cost” comparisons such as Lazard and recent (not current) EIA comparisons and those produced by many other government and private entities.
The principle of levelized costs is a legitimate one. The problem is that few publications allow the reader to review the basic assumption, and fewer are available outside of proprietary groups, which are less than four or five years out of date. For example the EIA levelized cost graph
i
which is presently a part of the 2011 Annual Energy Outlook is based on 2009 data. Although it shows that a new nuclear plant would sell power at 11.39 cents (compared to today’s wholesale market price of slightly less than four cents) per KWH, it also shows that wind would sell power at 9.7 cents (all the end values are 2016 values). This fails to reflect the modest peak in wind turbine prices in 2009 followed by a 30% drop by early 2011.
And while it might be possible to follow the data trail which EIA is particularly good at presenting, find out the assumed cost per KWH and the size of the assumed reference facility, it is extremely unlikely that the assessment presented by EIA reflects the true cost of a plant which takes twelve years to complete, since the example is presented in 2009 dollars, in 2011, projecting a 2016 in-service date. The much longer construction timeframe increases the cost logarithmically.
Overview:
The proposed Fermi 3 station would represent a 14% addition to Detroit Edison’s reported
ii
10,757 MW’scapacity in 2011. However, comparing the proposed capacity to the existing capacity is an inadequate means of determining need. Factors which should be considered include the relative capacity factors of various choices, their cost, the timing of availability and the historical pattern of consumption. Doing this with great accuracy is challenged by the fact that Federal information on individual utility off-system sales is not reported as clearly as most statewide data, and the DEIS seems to be considering this plant in the context of “The Southeast Michigan Area” which is a jurisdiction which is not reported on by the Federal Energy Information Administration. Based on Exhibit A-3 Schedule C3 in the 2010 Detroit Edison rate case filingiii Detroit Edison’s 2009 off-system sales appear to be no greater than 7.6% of their total revenues, and thus presumably a similar fraction of their total generation.
Fortunately, great accuracy is not especially valuable here, given the long term trend in Michigan electricity consumption and the rapidly shifting price relationships of various resource options. Much more important than five or six digit precision is a good understanding of the economics of the electric industry and how rapid changes in the industry are making long-held conventional assumptions obsolete.
The lack of growth in Michigan’s electric industry is illustrated in the graph of generation from 1990 to 2009 below. Some documents in the DEIS suggest an assumed increase in electricity consumption of nearly 50% over the next thirteen years, but that would imply a 3.8% annual growth rate, which is a rate not seen in the United States since 1970. The current long term projection by EIA is hovering around 1.1%.
Michigan's 2009 nuclear capacity was 4,314 MW's. Having generated 21,851,009 MWH's in 2009 this indicates that Michigan's nuclear industry operates at a 63% capacity factor. This is, to put it bluntly, miserable compared to the national average. To be fair, 2008 saw 31,484,428 MWH's and 2010 saw 29,624,580 MWH's, but the 21 year average, from 1990 to 2010 is a mere 66.01% capacity factor.
Furthermore, in its 2010 application for a rate increase, Detroit Edison included a projected sales path through 2020 which shows a decline in sales from today. This is a reasonable expectation given the early strong success of the Michigan Energy Optimization program, and Detroit Edison’s high quality performance in 2010 in developing energy efficiency.
Even with a substantial post-recession bounce in consumption Michigan and Detroit Edison are unlikely to see anything like a three or four percent annual growth rate. A more germane reason to examine new capacity additions is the fact that Detroit Edison’s fleet includes several dozen ancient, dirty and expensive fossil fuel plants. In fact it may be prudent to retire more than the 2,039 MW’s identified in the DEIS.
This report seeks to emphasize relative costs, availability and timing issues associated with electricity supply, and the critical importance of flexibility in planning. The generation potential of Fermi 3 will be used as a benchmark, not because there is any evidence that it is the right amount or the right sort, but because if the right economic signals are identified and responded too, Detroit Edison may seek to develop a larger amount of different sorts of resources, or alternatively (with less positive impact we believe) a smaller amount of different sorts of resources, and in either case is likely to map out an energy supply for Southeast Michigan which is preferable to the one which would result from Fermi 3.
Detroit Edison and Efficiency:
Michigan’s current efficiency programs are growing robustly in accordance with PA 295. Detroit Edison is shown to have spent approximately $75 million in 2010, and to have saved
iv
approximately $374 million. (Chart 5 in the report referenced here details the Detroit Edison experience). This 1:5 cost:benefit ratio is typical of the lifecycle savings resulting from well run efficiency programs, and similar to results in Ohio, where a similar law is being implemented in a similar timeframe.
It is important to note that these programs typically install hardware in homes, businesses and factories, which save energy for an average life of about 12 years, with a wide range depending on the specific technology. Therefore, the total benefits are accrued over those years, with the single year savings being those set by the standard, or by the standard plus overcompliance. Thus, Michigan required Detroit Edison to save 0.3% in 2009, 0.5% in 2010, 0.75% in 2011, and 1% in 2012. Leaving aside the actual overcompliance, this standard would nominally create a net benefit which is expressed as the lifecycle savings (i.e. the $5 saved for every $1 spent) or alternatively, as the sum of the previous years’ achievements. So by year end 2012, Michigan’s standard would create an annual reduction in system energy requirements of 2.05%. PA 295’s electric standard stops increasing at 1% in 2012, and holds steady. So each additional year adds an additional one percent to the cumulative savings. Since 1% is exactly what the most recent EIA Annual Energy Outlook projects for new growth in the U.S. a flat generation path is a reasonable prediction.
Efficiency savings are not permanent, but in practice over the last forty years the Federal efficiency standards plus gradual shifts in the marketplace have made most efficiency program savings permanent. It is only in the last four years that total U.S. savings from utility efficiency programs have passed the half-percent per year mark that the impact of this has become large enough to have a visible impact on the total electricity trend. The dynamic of efficiency programs creating savings and appliance standards shoring them up is likely to persist for several decades at least.
Efficiency Potential Is Not Limited:
Illinois, Indiana and Ohio all have standards that increase to 2% annual savings. There are five or six states whose utilities are presently actually achieving between one and a half and two percent per year, and there are historical examples of programs ranging from 4% to as high as 7% for periods of one or more yearsv. Ironically, all but two of these historical examples followed in the wake of nuclear plant construction project failures. One of those two was Three Mile Island (a plant failure, as opposed to a construction failure) and the other was the California natural gas crisis in 2001. The California crisis is instructive, because California had operated programs between one and two percent for over twenty years at the time, and the result was that California citizens and businesses had a better understanding of efficiency, and the delivery systems were in place to facilitate a sudden large increase in demand for efficiency. California’s experience in 2001 simultaneously disproves claims which are often heard that efficiency potential is small, constrained, and will diminish over time. Certainly, it didn’t do so in California after twenty years at a higher percentage savings level than Detroit Edison achieved in 2010. California is one of the states which has since increased program activity and is now approaching the 2% annual savings mark.
This is not the place for an extended discussion of the upward side of efficiency potential, but it is in the interest of Detroit Edison, and its customers, to be aware of the value of proper shared savings and cost recovery mechanisms. In this era the gulf between the cost of saving electricity and the cost of using it is widening rapidly. This is due to the increasing cost of energy and the falling cost of efficiency technologies.
Should Michigan’s efficiency standard not be increased above 1%, but be preserved at 1% beyond the specific years stated in PA 295 the Southeast Michigan region will have seen 15% of its total electricity sales met with efficiency by 2025. The actual impact will be net of new growth. Efficiency programs such as those in Michigan are saving electricity at a cost of approximately 2 cents per KWH or less. The logic of restricting efficiency measures to those which cost less than three cents per KWH when construction of a massive new plant which will cost 9 or 12 or 18 cents per KWH is being considered, or even built, is not likely to have great appeal as we advance through this decade.
There remains some reason to believe that Michigan has not properly incentivized Detroit Edison to consider efficiency as a serious resource. Again, this is not the time or place to dig in to that issue, but the struggle to advance efficiency in the United States has always had its opposition rooted in the fact that we pay utilities quite handsomely to generate electricity, and regardless of the public benefit, the utility will conform to its own economic interest, rather than that of the public, unless the benefits are appropriately shared.
A much larger context for Efficiency:
Although this report addresses Fermi 3, the larger context in the U.S. electric industry is the pending pollution controls which will make the remaining 30% of the coal fleet impossible to operate without massive new expenditures. Efficiency is unquestionably a cheaper resource than a new nuclear plant. Efficiency is able to save energy at a quarter or less of the cost of new natural gas generation and a fifth or less of the cost of new coal generation. But the real economic question which faces most of the Eastern U.S. and the lower Midwest more than anywhere else is the comparison of the cost of efficiency versus the cost of pollution controls and sustained fuel and operation of the remaining unscrubbed fraction of the coal fleet.
Given the timing of engineering and construction, compliance decisions must be nearly completed for most high coal utilities in the next 24 months. That means that regulatory support and proper compensation for strong efficiency programs must be sufficient to allow the utility to decide how large the programs should be, and to find out how large they can be, and all on a fairly short timeline.
Ironically, the decision point on all these pollution controls and plants is almost completely independent of the presence or absence of Fermi 3. The nuclear plant cannot be completed in time to make any difference in the coal plant utilization question.
The point of making these comments here is that all of this revolves around a comprehensive understanding of the economics, not just the simplistic cost per MW or the price of the output, but the economic impact on customer, utility, and the effect of time and timing on cost and availability. Fermi 3 should be part of an Integrated Resource Planning Process which is in place in Michigan. There seems to be a requirement for an Integrated Resource Plan to be developed before Fermi 3 can be approved by the MPUC. Unfortunately, the time for such a process to provide maximum benefit is nearly past, without reference to Fermi 3, but with reference to the pollution regulations. This is not the NRC’s responsibility, but it does underscore the lack of planning which is associated with the proposal of a 1600 MW nuclear generating station for this utility in this region at this point in time.
Detroit Edison and Wind:
Michigan has a massive potential for onshore wind energy development, approximately 175,000
vi
MW’s of potential at 30% capacity factor and 100 meter hub heights. (This reference includes a wind map which shows that most of Michigan’s better wind resource is in and around the Detroit Edison Service area). Offshore wind development is still in a pilot stage, and is irrelevant to the question of resource decisions through this decade and into the early years of the 2020’s.
At 30% capacity factor, 175,000 MW’s of wind could theoretically generate the same amount of power as 58,000 MW’s of nuclear power. At today’s prices for wind turbines, large swaths of the United States are prime candidates for generation of new wind power that can be sold at wholesale for six cents per KWH or less. The 30% capacity factor measure indicates economic viability at today’s prices, and the point here is that Michigan’s wind resource is equivalent to at least thirty-seven Fermi 3’s, when what is called for is approximately one percent of that resource, in conjunction with a strong efficiency program and a few other resource decisions.
In other words, we are not suggesting that Fermi 3’s potential generation be met with wind power. We are suggesting that approximately a third of it can be met with wind power, while the other two-thirds of it can be met with efficiency and other renewable resources, and that we suspect that photovoltaics will be the most important of those other resources by 2025.
The average cost of wind sold in the U.S. from 2003 through 2007 was under four cents per KWHvii
2010 prices for wind turbines were 19% lower than in 2007. In early 2011, turbine
viii
prices were under $1,350/KW. This allows 30% capacity factor wind to generate electricity for less than six cents per KWH in any location. The 30% capacity factor criterion is the determinant factor in the cost of the power, with some reservation about locations remote from wind manufacturing (not applicable to Michigan, which may be the U.S. leader in wind component manufacturing).
Michigan’s renewable energy standard calls on Detroit Edison to develop 300 MW of new
ix
renewables by 2013 and 600 MW by 2015, or ten percent of its salesx. Ten percent in five years is a fairly strong goal, but it must be sustained beyond 2015, not only to produce optimum results, but also to ensure the investment in manufacturing capability which is required to get there in the first place. By continuing to build wind at the same rate until 2025, Detroit Edison will have thirty percent of its capacity in wind. That may seem like a tall order today, but it will likley look better and better as the region moves toward it.
The combination of efficiency plus wind which we sketch out here, is a net zero cost strategy to meet Michigan’s future electricity requirements. No other strategy can meet Michigan’s future electricity needs without substantial increases in the price of electricity and the total cost. Efficiency savings are large enough to permit the full replacement of nuclear and fossil fuel generation as needed, provided the right balance of efficiency and renewables is achieved.
One of the primary objections to wind power is that it is not dispatchable. We observed above that Detroit Edison has a “needle peak” problem, and with a load shape like that, a massive nuclear plant, a single generating unit upon which the region would depend for 29.7% of its power or more, is simply a grossly inappropriate choice. To respond to the load shape issues, we advocate efficiency, load management, and exploration of photovoltaics as prices continue to fall, but in fact the variability of wind might allow Detroit Edison to utilize its existing peak generation resources more efficiently. With a daily rise and fall in the consumption of electricity that is certainly more than 50% of the peak on most days, the development of twenty or thirty percent of Detroit Edison’s total generation in the form of windpower cannot possibly challenge the existing peaking capacity. Based on Michigan’s fuel use pattern, we assume that most of that is natural gas, and is not among the large group of plants that seem to be slated for closure.
In addition to existing load management resources that make the first thirty to forty percent of wind benign without substantial new load management resources to most utilities, there are a group of emerging technologies that store energy. The list is long, but two deserve mention: Compressed Air Energy Storage is a process which is fully technologically available. There are only a handful of completed utility-scale CAES projects in the world, and perhaps only one in operation in the U.S. (Louisiana) and one recently announced new project (Nebraska). But pricing is such that wind plus CAES can provide a 100% dispatchable electric resource at half the cost of a new coal plant per MW of capacity. Since a single MW of Compressed Air Energy Storage would typically provide storage for two or more MW’s of wind generation this is likely to erupt into a major new energy resource in the very near future.
The other energy storage technology which deserves mention is Ice Storage Thermal Cooling for large commercial buildings. It is cheap enough to produce a net benefit merely by allowing utilities to provide cooling for buildings when demand is low.
These and the other energy storage technologies are not household names or concepts, but we are either going to develop them rapidly to protect ourselves from higher electric costs due to more expensive resource choices, or we are going to develop them less rapidly in response to higher electric costs due to more expensive resource choices.
A decision to invest in an extremely expensive power plant which provides 29% or more of the utility’s total capacity is pretty plainly putting all of one’s eggs in a single basket.
A word about the Wind Production Tax Credit:
It is reasonable to wonder if the price of wind is low enough to be economic if Congress repeals the Wind Production Tax Credit (WPTC). The WPTC is inflation adjusted, and in 2011 was
2.11 cents per KWH. Also in 2011, the average price of coal in the U.S. was 2.35 cents per KWH. In other words, every penny of WPTC expenditure produces real net benefits. Not large, if compared to the price of coal alone, but then the wind generation produces electricity that undercuts many other resources. And in Michigan, electricity which costs six or seven cents per KWH, which will never experience a fuel cost increase, which will never be incapacitated by a single event at a single location, and which can bring billions of dollars of new investment and thousands of jobs should be seriously considered. The fact that Michigan is one of the top two manufacturers of wind turbine components in the United States is probably well known to most of the parties concerned with this matter.
Photovoltaics:
Photovoltaics (PV) are not economic in Michigan in 2012, without tax abatement support or some other form of subsidy – if the value of the electricity generated is compared to the average retail cost of electricity. But that is hardly the end of the story. Photovoltaics have experienced a two decade sustained drop in cost, and are now becoming almost ten percent cheaper each year. During 2011 several Southwest U.S. states recognized that PV today is cheaper than the likely cost of power from a new efficient Combined Cycle natural gas power plant, given likely fluctuation in natural gas fuel prices. This is also a function of the greater sunlight available in those states. But as prices drop, the region where PV is competitive against the average cost of power sweeps across the nation. As the trend continues it suggests that within three to five years PV will be competitive with fossil resources here in the Midwest.
And that is still not the end of the story. PV is already economic if it is recognized as a peaking resource. PV always works best when the local utility experiences its daytime peak energy loads, because both are driven by sunlight. The regional market for peak power can reach multiples of the retail price of electricity very quickly. For Detroit Edison, with so much capacity needed for so few hours of the year, PV may be more economic than elsewhere in the
U.S.
Like wind, the opportunity for Detroit Edison and for the Michigan economy is not just the potential for low cost power, but the potential for manufacturing and installation jobs. And to complete the circle, creating a foundation for those jobs and that economic activity in the Detroit Edison Service Area creates economic health which will ensure Detroit Edison’s own future.
PV, unlike wind, has no clear barrier to sustained cost reduction for some time to come. Wind has been close to its technological peak efficiency in terms of harvesting energy from moving air, for several decades. The recent huge cost reductions have resulted from economies of scale in production, and from the substantially greater energy in moving air at higher hub heights.
Experts feel there is room for perhaps another 20% drop in turbine cost before wind costs stabilize. But for PV there are multiple approaches to converting sunlight to electricity, and multiple opportunities to make each approach better and cheaper.
Nuclear power advocates used to claim that it would make electricity “too cheap to meter”. Well, efficiency actually has achieved that goal. By various measures, efficiency has provided between 40 and 77% of all new energy added to the U.S. economy over the last forty years, and it is not recognized as an energy resource by most people, let alone the resource which has provided the most economic benefit in the entire energy sector. Now we see experimental development of photovoltaics produced on printing presses, photovoltaic films built into windows, roof shingles, siding, perhaps even a photovoltaic paint will come along. It’s premature to suggest that this will happen, but it is equally clear that we can move in that direction, if we choose to explore the opportunity.
And in that light, Fermi 3 is a door-closer. With a massive $15 to $20 billion dollar loan to pay off, what incentive will Detroit Edison have to explore these resources?
Combined Heat and Power:
Combined Heat and Power or Waste Heat Recovery is another area which Detroit Edison should consider carefully. Michigan is relatively advanced in its development of these resources compared to other states, but there is a substantial untapped resource compared to even Michigan’s several thousand MW’s of CHP.
Problems Facing the Natural Gas Industry:
EIA rojects that by 20 5, about 47% of U. . natural as will come from frackin xi. But they simultaneously roject that about half of that will re lace a in conventional natural as wells. Total rowth is rojected to be 26%, a mere one ercent above ex ected o ulation rowth.
At the resent time we use about 0% of our natural as to enerate about 20% of our electricity. Obviously, if the rojection over 25 years allows only one ercent of increased roduction over o ulation rowth there isn't a lot of room for new uses. Mathematically, the EIA rojection allows for natural as to increase to 26.6% of total
U. . electricity.
Natural as is extremely volatile in rice, and the bi est factor in that volatility is any mismatch between su ly and demand. A 2% increase in demand over su ly results in a doublin of the retail rice of natural as. This has been demonstrated in both natural as and etroleum about six or ei ht times in the last twenty years. imilarly, a 2% decrease in demand over su ly results in a 50% dro in the rice. And around $7/mmbtu, which is double the current rice of natural as, but only about a dollar over the rice twenty months a o, all utilities sto usin natural as for every
enerator they can ossibly find an alternative for.
Thus any shorta e of as will be met by a sur e of roduction which will in turn be
met with a dro in consum tion, resultin in rices fallin down to the minimum the
roducers can afford to sell at. Aside from the roblems which would be created for
eneration of electricity, this hi h rice volatility will be extremely hard for the eneral
ublic due to current de endence on natural as for s ace heatin .
There is only one rational res onse to this set of conditions� The United tates must learn to reduce natural as consum tion in order to avoid the need to ress u a ainst the limits of roduction at any time. There are owerful efficiency alternatives to increased natural as use.
This is ertinent to the �ermi �uestion only that natural as is ex eriencin a heyday of o ularity, but it does not necessarily offer a ood fit with the articular needs of �etroit Edison as a new resource alternative to �ermi .
Summary:
The key to a positive outcome of this question is to understand that nuclear power has no inherent value if it does not improve the community, and that a proper assessment of alternatives will rule the plant out.
Michigan and Detroit Edison must determine how to meet the pending air pollution regulations, which requires decisions affecting about 61% of Detroit Edison’s generation resources, to be completed in the next two years or so, and the implementation of those decisions to be largely completed by the end of 2015, none of which can be affected by Fermi 3. However, if those decisions favor rapid expansion of efficiency and renewables in concert with the real economics and the real flexibility of those resources, it is entirely possible to provide more capability than Fermi 3 offers for a fraction of the cost.
The right mix of efficiency plus renewables is likely to cost less than the current cost of electric generation from existing fossil fuel plants or a new nuclear unit through the next fifteen years and beyond. This right mix is not just cheaper than new nuclear power, it is cheaper than any other resource strategy which meets the needs of the service area. This strategy is highly robust in the face of any sort of unanticipated change in the service area conditions, and is highly flexible in the face of unanticipated change in the availability of other generation.
Although we have identified efficiency and wind, plus photovoltaics in the near future as the core strategy that performs better than a single massive new nuclear unit, there is ample room for additional resources – hydropower should any be available, biomass, should it prove economic, combined heat and power, and even some new natural gas generation should it prove possible to secure a long term fuel resource at an affordable cost, the characteristic of this strategy that deserves attention is the flexibility, as much or more than the fact that these resources are largely clean and renewable.
None of us know the future. Finding ourselves in a situation five years from now which shows our chosen path to be flawed is much less painful if we have hundreds of thousands of efficiency technologies and thousands of distributed generation resources, all of which are paid for already, than if we get to the same point and have one single massive facility which has several billion dollars committed, no immediate benefit to offer, and another five or so years and another many billions of dollars to go before a single KWH can be generated.
Ignoring the fuel choice or the technology, a single large generator creates problems either because it must be oversized for the load that exists when it goes into service, or it must go into service after some years of inadequate capacity. Simply put, this would be bad management of the responsibility to provide electric service.
-Ned Ford
3420 Stettinius Avenue Cincinnati, Ohio 45208 513/600-4200
January 11, 2012
End Noter:
ihttp://205.254.135.7/oiaf/aeo/electricity generation.html See Table 1, about halfway down the web page.
ii Testimony of Paul Fessler in DTE-2011-Hearing-Vol6 page 429 Case No. U-16472 iiihttp://efile.mpsc.state.mi.us/efile/docs/16472/0005.pdf
ivhttp://www.michigan.gov/documents/mpsc/eo legislature report2011 369985 7.pdf
vhttp://www.aceee.org/research-report/e115 The top ranked states shift places from one year to the next. Figure 2 shows eight states with budgets and actual spending over 2%. Figure 4 shows actual savings exceeding 1.5% for only one state, but also shows the variation from 2008. Since 2009 several states have implemented policy intended to reach or exceed 2%, and prior to this report at least four states have passed the 2% mark for a year or more. Among the historical programs discussed in this section, only the California 2001 experience is recent enough to be included in these recent reviews.
vihttp://www.windpoweringamerica.gov/wind resource maps.asp?stateab=miThe map at this link shows that much of the best wind in Michigan is in or near the Southeast Michigan region. The graph below the map shows the doubling of wind generation potential which results from raising the hub height from 80 meters to 100 meters.
viihttp://eetd.lbl.gov/ea/ems/reports/lbnl-275e.pdf (see top of page 17 for price history)
viiihttp://www.grist.org/article/2011-02-07-report-wind-power-now-competitive-with-coal-in-some-regions
ixhttp://dsireusa.org/incentives/incentive.cfm?Incentive Code=MI16R&re=1&ee=1
x
There is some sort of mathematical error in the presentation of PA 295 at this reference. 600 MW's of any form of renewable generation is not going to produce ten percent of Detroit Edison's retail sales. It would take about a 70% capacity factor, and while some biomass generation technologies might operate at that level, wind, photovoltaics and hydropower are all variable resources with lower capacity factors. There might be enough biomass in Michigan to fuel 600 MW's but it would be terribly expensive, devastating to the State's forests, and would provide a negative carbon impact, due to the water in wood, which reduces the efficiency of combustion, and makes biomass generation a larger source of C�2 per �WH than coal. There is un�uestionably not enough wood in the Detroit Edison service area to fuel 600 MW's of biomass.
xihttp://www.eia.gov/forecasts/aeo/chapter executive summary.cfm Figure 2 at this link, and the data which is accessible from that part of the page, provide a clear sense of the limits of U.S. shale gas production.
Ned Ford (Edward Clark Ford) 3420 Stettinius Avenue Cincinnati, Ohio 45208-1204 513-533-9244 Ned.Ford@fuse.net Chairman of the Miami Valley Power project (intervenor in Zimmer nuclear power plant licensing process) 1983 - 1984 Member of Sierra Club's national Energy Committee 1987 - 2005 Established and manage the Club's Energy Forum and Global Warming Forum listserves. Managed several major policy development processes for the Sierra Club (Wind Siting Advisory, Biomass Guidance and Energy Resources Policy). Energy Chair of the Ohio Chapter of the Sierra Club from 1984 through 2009. From 1992 through 1996 represented the Sierra Club in customer collaborative meetings with four of Ohio's electric utilities (Cleveland Electric Illuminating, Toledo Edison, Dayton Power and Light and Cincinnati Gas and Electric), advising on Demand Side Management programs. Sierra Club's liaison in over 25 formal interventions in regulatory proceedings that affected environmental impacts from Ohio's electric utilities. 2009 to present: Consultant to the Sierra Club Ohio Chapter and to the Sierra Club Beyond Coal Campaign on electric and natural gas utility regulatory issues, energy efficiency, renewable energy, and resource selection issues. Sierra Club's liason in over 20 formal interventions in regulatory proceedings affecting environmental impacts from Ohio's electric utilities. 2005: Witness in Sierra Club intervention in Kansas City Power and Light investigation into the permitting of the Iatan II coal power plant. Other clients and other endeavors not pertinent to this proceeding.
_'_
POTENTIAL HEALTH RISKS POSED BY ADDING A NEW REACTOR AT THE FERMI PLANT
Radioactive contamination from Fermi 2 and changes in local health status
Joseph J. Mangano, MPH MBA Executive Director Radiation and Public Health Project January 6, 2012
TABLE OF CONTENTS
ExecutiveSummary.................................. 3 Introduction...................................... 4 Radiation Contamination Produced by Fermi – Actual and Potential. . . . . . . . . 6 Demographics-AreaClosesttoVogtle. . . . . . . . . . . . . . . . . . . . . . . . 10 Local Levels of Radiation Sensitive Health Indicators Since Startup of Fermi 2. . .12 Discussion. . . . . . . . . . . . . . . . . . . . . . . . . . . . . . . . . . . . . . .20
EXECUTIVE SUMMARY
In November 2008, Detroit Edison submitted an application to the U.S. Nuclear Regulatory Commission (NRC) for a new nuclear reactor (Fermi 3) in southeast Michigan. In October 2011, an Environmental Impact Statement (EIS) was released for public comment, and the following report addresses issues of environmental impact.
Even though it mandates a lengthy process before deciding on whether to grant a license to the proposed new reactor, the NRC has no provision mandating that the utility produce evidence demonstrating the safety of the new unit. Neither was addressed in the EIS, other than to conclude (without empirical evidence) that the potential for meltdown would be extremely small, and that routine radioactive releases into the environment would not harm local residents. This report provides a basic “report card” of operations at Fermi 2 as a means to help evaluate safety and health issues posed by Fermi 3.
Contamination from Fermi 2 – both potential and actual – are multiple and concerning. The chance of a meltdown at a nuclear reactor is all too real. Prior meltdowns from human error at places like Three Mile Island and Chernobyl have been augmented by the 9/11 attacks in 2001, which created a real threat of a meltdown from acts of sabotage, and by the 2011 earthquake and tsunami in Japan, which caused meltdowns at four reactors at the Fukushima plant. Fermi 2 has had several “near miss” meltdowns in the past decade. With a population of 4.8 million living within 50 miles of the plant, a meltdown would be catastrophic for the Detroit area, along with parts of Ohio and Canada.
Like all reactors, Fermi 2 has routinely emitted radiation into the local air since it began operating in 1985. Several assessments suggest that emission levels have been higher at Fermi than for most U.S. reactors.
Analyses were conducted on changes in the Monroe County (vs. the U.S. or Michigan) rates of diseases and deaths known to be especially susceptible to radiation exposure since the 1980s (before and just after Fermi 2 startup). Of 19 indicators, the Monroe County rate change exceeded the state or nation for all 19, with 10 of them statistically significant and 4 others approaching significance. These indicators included:
More analysis is merited here, but these strongly consistent findings should be taken seriously. This report concludes that no decision should be made on whether or not to approve a license for Fermi 3 until more research of this type is undertaken; a thorough public education and discussion process occurs; and that the majority of local people still approve of the new reactor with this additional knowledge.
INTRODUCTION
The Fermi nuclear plant is located on Lake Erie, in Monroe County Michigan, about 26 miles south of Detroit. The table below shows Fermi has been the site of two operating nuclear reactors; Fermi 1 closed in 1972, while Fermi 2 is still in operation. A new Fermi 3 reactor was ordered in 1972, but cancelled two years later (Table 1):
Table 1 Reactors Ordered at the Fermi Nuclear Plant
Reactor Megawatts Application Went Critical Closed Fermi 1 61 6/ 1/56 8/23/63 9/22/72 Fermi 2 1065 7/26/68 6/21/85 Fermi 3 1171 1/ 1/72
Source: U.S. Nuclear Regulatory Commission, www.nrc.gov
In November 2008, Detroit Edison Company proposed building a new 1520 megawatt (electrical) Fermi 3 reactor at the site, and is seeking a “Combined Operating License” from the U.S. Nuclear Regulatory Commission (NRC). The NRC prepared a draft Environmental Impact Statement (EIS) in October 2011, a legal mandate as part of the process of considering whether or not to grant approval for the development of Fermi 3.
This report will examine whether the EIS sufficiently addressed two subjects, i.e. the potential contamination from a new Fermi 3, and potential health risks of this contamination to local residents.
The contamination from reactors such as those at Fermi involves a process known as fission, which occurs when Uranium-235 is bombarded by neutrons. (Before this point, U-235 must be mined, milled, converted, enriched, and fabricated). This is exactly the same process in an atomic bomb explosion, except that the process in nuclear reactors is controlled.
As uranium atoms split, neutrons strike other U-235 atoms, causing a chain reaction in which extremely high heat is created. Breaking U-235 atoms apart also creates several hundred new chemicals, known as fission and activation products. They are not found in nature, but formed by the re-arrangement of protons, neutrons, and electrons from the old U-235 atoms.
Some of these chemicals have become well known during the atomic era of the past 65 years, including Iodine-131, Cesium-137, and Strontium-90. Despite efforts by reactor operators to contain these chemicals within the reactor building, some must be routinely emitted into the air and water, during daily operations and refueling. These metal particles and gases are returned to the earth through precipitation. They enter the human body by breathing and the food chain, where they kill and injure cells by emitting alpha particles, beta particles, or gamma rays. A damaged cell may or may not repair itself; if it fails to do so, it will duplicate into similarly damaged cells, which can lead to mutations and cancer.
While all humans are harmed by fission products, the fetus, infant, and child are most affected. Adult cell division is relatively slow, giving a damaged cell a better chance for repair. But fetal and infant cells divide at a very rapid rate, making repair of the damage less likely. The fetal and infant immune system is also relatively immature, making it less likely to fight off mutations that can become cancer.
The cocktail of over 100 chemicals attacks various parts of the body. Radioactive iodine attaches to the thyroid gland. Strontium seeks out bone and teeth, and penetrates into the bone marrow. Plutonium enters the lung. Cesium disperses throughout the muscles. Thus, exposure to the mix of radioactive elements can raise risk of many diseases, not just bone or thyroid cancer.
RADIOACTIVE CONTAMINATION PRODUCED BY FERMI – ACTUAL AND POTENTIAL
Possibility of Meltdowns. The radioactivity produced by nuclear reactors like those at Fermi can be released into the environment, and thus into human bodies, in large amounts (via a meltdown) or smaller amounts (via routine releases or deliberate releases). The EIS does not adequately address potential and actual radioactive emissions from Fermi. It minimizes the chance of a meltdown, which can occur from human error (like Chernobyl or Three Mile Island), act of sabotage (terrorist organizations have been known to target U.S. reactors), or act of nature (like Fukushima). In addition, human error accounted for a partial meltdown at Fermi 1 in 1966, which came dangerously close to a huge environmental release of radioactivity.
In 1982, Sandia National Laboratories reported to Congress the number of humans that would be affected by a worst-case meltdown near each U.S. nuclear plant. The figures for a meltdown at Fermi 2 included 8,000 deaths from acute radiation poisoning and 13,000 cancer deaths within 15 miles, along with 340,000 non-fatal cases of acute radiation poisoning within 70 miles. The figure of 340,000 is the highest of any U.S. reactor except for Limerick, located near Philadelphia. (Calculation of Reactor Accident Consequences, or CRAC-2, reported to the House Committee on Interior and Insular Affairs Subcommittee on Oversight and Investigations, November 1, 1982).
Although any meltdown would have devastating consequences, such an event at Fermi 2 would be especially harmful. While just 92,377 persons live within 10 miles of the plant, 4,799,526 live within 50 miles, including the metropolitan areas of Detroit MI, Toledo OH, and Windsor Canada.
The recent devastation at Fukushima just 10 months ago is a tragic reminder that the risk of a meltdown is all too real, and should be a major consideration when evaluating whether to bring new nuclear reactors on line.
Aging Reactors Operating Most of Time. For years, U.S. nuclear reactors operated barely half the time, due to frequent mechanical problems. But beginning in the late 1980s, utilities made upgrades that reduced shut down time, even correcting mechanical flaws while reactors continued to operate. In addition, “refueling” nuclear reactors is now done much less often (about every 18 months), and the time that a reactor is shut down for refueling, a complex process, has been greatly reduced, to several weeks.
While this practice is a positive one from a financial point of view, it raises concerns from a health standpoint. Reactors are aging – virtually all are at least 25 years old – and their parts are becoming increasingly brittle and susceptible to breakdown. The practice of keeping reactors in operation more of the time is akin to driving an old car with many miles on it increasingly long distances.
Table 2 shows that the Fermi 2 plant operated 91.0% of the time from 2000-2005, a figure roughly equal to the national rate. The U.S. Nuclear Regulatory Commission stopped publishing monthly hours of operation on its web site several years ago; but even though exact figures are not known, it is highly likely that post-2005 capacity is similar to the prior several years.
A high capacity factor increases the risk of meltdowns. It also increases the likelihood of routine emissions of radioactivity escaping into the environment.
Table 2 Percent Capacity (% of time in operation) Fermi 2 Reactor, 2000-2005
Source: U.S. Nuclear Regulatory Commission, www.nrc.gov.
Near Miss Accidents. In 2006, the group Greenpeace published an analysis of “near miss” meltdowns at U.S. nuclear reactors in the 20 years since Chernobyl. There were 200 such events on the list, and two occurred at Fermi 2. On January 28, 2001, the reactor’s emergency diesel generator was inoperable for more than seven days. On August 14, 2003, the reactor experienced a loss of offsite power due to the blackout in the northeast U.S. (Source: An American Chernobyl: Nuclear “Near Misses” at U.S. Reactors Since 1986, www.greenpeace.org).
Shut Downs for Over a Year. Also in 2006, the Union of Concerned Scientists published a list of U.S. nuclear reactors that had been closed for at least a year. One was Fermi 1, which was closed from October 5, 1966, when it experienced a partial meltdown, and did not re-start until July 18, 1970. The reactor operated very little thereafter, and closed permanently two years later.
The other long outage occurred at Fermi 2, from December 25, 1993 to January 18, 1995, a total of 13 months. (Source: Union of Concerned Scientists: Unlearned Lessons from Year-Plus Reactor Outages, www.ucsusa.org).
Actual Emissions. Each utility company operating a nuclear reactor is required by law to measure actual emissions of various types of radioactivity into the environment. There are various chemicals included in these reports, but several show that Fermi 2 may be one of the reactors with the greatest emissions in the U.S.
One type of chemical reported is Iodine-131, produced only in nuclear reactors and
th
weapons tests. In the year 2002, for example, Fermi 2 released the 10highest amount of I-131 into the air, out of 68 reactors with reported emissions. The Fermi total of 9,280 microcuries of I-131 was far above the median of 496 for the 68 reactors (Table 3). I-131 has a half life of 8 days, and seeks out the thyroid gland, where it destroys and injures cells.
Table 3
U.S. Reactors with Greatest Emissions of Airborne I-131, 2002 (Total 68 Reactors, Medican Microcuries = 496)
Reactor Microcuries
Source: U.S. Nuclear Regulatory Commission, Radiation Exposure Information and Reporting System (www.reirs.comm/effluent).
In addition, Fermi 2 released a relatively high total of Strontium-89 into the air in 2002.
th
Its total of 418 microcuries ranked 7highest of 33 reactors with reported releases, and its total was far above the national median of 36 microcuries (Table 4). Radioactive strontium seeks out bone and penetrates into the bone marrow, where the red and white blood cells so important to the immune system are formed. Sr-89 has a half life of 50 days.
Table 4
U.S. Reactors with Greatest Emissions of Airborne Sr-89, 2002
Reactor Microcuries
1.Oyster Creek NJ 8630
2.LaSalle 1 IL 7350
3.Cooper Station IL 1980
4.Quad Cities 1 IL 1850
5.Dresden 2 IL 986
6.Nine Mile Point 1 NY 655
7. Fermi 2 MI 418
1.Browns Ferry 1 AL 355
2.Vermont Yankee VT 281
3.River Bend LA 199
There is also evidence that Fermi 2 emissions are relatively high for periods more recent than 2002. Table 5 shows the volume of gaseous emissions of tritium during 2007 from
th
U.S. nuclear plants. Of the 60 plants with reporting data, Fermi ranks 13highest. Its total of 124.60 curies ranks well above the U.S. median of 55.23. Table 5
U.S. Nuclear Plants with Greatest Emissions of Airborne Tritium, 2007 (Total 60 Plants, Median Curies = 55.23)
Plant Curies
1.Palo Verde AZ 1934.7
2.Hope Creek/Salem 1-2 NJ 414.1
3.Cook 1-2 IL 291.4
4.Brunswick 1-2 NC 256.0
5.Harris NC 235.9
6.McGuire 1-2 NC 204.3
7.Diablo Canyon 1-2 CA 193.7
8.Catawba 1-2 SC 187.9
9.Nine Mile Point 1-2 NY 158.1
10.St. Lucie 1-2 FL 138.1
11.Waterford LA 131.8
12.Sequoyah 1-2 TN 131.2
13. Fermi 2 MI 124.6
Source: U.S. Nuclear Regulatory Commission, Radiation Exposure Information and Reporting System (www.reirs.comm/effluent).
Gaseous tritium emissions appear to be rising over time. Table 6 shows the amount of reported emissions for each year from 2001 to 2007. Although not all quarterly reports showed actual emissions, it still appears that levels are rising over time.
Table 6 Gaseous Tritium Releases, by Year, 2001-2007, Fermi 2 Plant
Source: U.S. Nuclear Regulatory Commission, Radiation Exposure Information and Reporting System (www.reirs.comm/effluent).
DEMOGRAPHICS -AREA CLOSEST TO VOGTLE
Fermi is located in southeastern Monroe County, which means that all residents live within 20 miles of the Fermi plant, and the majority of residents live within 10 miles. Because of this proximity, and because the National Cancer Institute 1990 study of cancer near nuclear plants selected Monroe County as the “local” area closest to Fermi, this study will also use the county as the focal area of analysis.
There are limits by using the county as the study area. Prevailing winds tend to blow towards the east, i.e. into Lake Huron, and thus local residents may not absorb the greatest doses of radioactivity released from Fermi. Using the entire county does not examine whether there are health differences in Monroe County populations closest to Fermi vs. those further away – essentially because of the difficulty in obtaining sub-county health data. However, winds swirl, propelling Fermi radioactivity not just to the east, but to the west, north, and south. The municipal water supply is located very close to Fermi. And fish caught in Lake Huron are most likely to be consumed by local residents. For these reasons, Monroe County should be a relatively meaningful area
Demographic characteristics of Monroe County, compared to the state and nation, are given in Table 7 below:
Table 7 Demographic Characteristics, Monroe County vs. Michigan vs. U.S.
Category Monroe Michigan United States 2010 population 152,021 9,883,640 308,745,538
2010 % < 18 years 24.1 23.7 24.0 2010 % > 65 years 13.4 13.8 13.0 2010 % Female 50.7 50.9 50.8
2010 % White 94.4 78.9 72.4 2010 % Black 2.1 14.2 12.6 2010 % Asian 0.6 2.4 4.8 2010 % Hispanic 3.1 4.4 16.3 2010 % White non-Hisp. 92.5 76.6 63.7
2005-09 % Foreign born 1.9 6.0 12.4
2005-09 % High School grad 87.7 87.4 84.6 2005-09 % College grad 17.1 24.5 27.5
2009 % Below Poverty 10.7 16.1 14.3 2009 Median Household Inc. $53,224 $45,254 $50,221 With a population just over 150,000, Monroe County is similar to the state and nation in terms of gender and age distribution. The proportion of residents that are minorities is much lower in Monroe, as is the percent of foreign born. The percent of college graduates is low, but so is the percent living below poverty.
While there are differences in demographics between Monroe compared to Michigan and the United States, these differences have existed for many years. Therefore, temporal trends over time are appropriate when comparing Monroe County to the state and nation.
This report will examine changes in health status before and after the startup of Fermi 2, using official data from a variety of health indicators.
LOCAL TRENDS IN RADIATION-SENSITIVE HEALTH INDICATORS SINCE STARTUP OF FERMI 2 REACTOR
Infant Deaths. The segment of the population that is most susceptible to the damage inflicted by radiation exposure is the fetus and infant. The very young have immature immune systems; and their cells are dividing so rapidly compared to adults there is less of a chance that a fetal/infant cell damaged by radiation can self-repair before dividing – into more damaged cells.
Data are available for several types of infant and fetal health indicators at the county level. The first is infant deaths, which is one of the more commonly used indicators of a society’s health. Annual infant deaths and death rates for each U.S. county is available from the U.S. Centers for Disease Control and Prevention, for the 30 year period 1979 to 2008. This means a baseline period of 1979-1984 – after the shut down of Fermi 1 and before the startup of Fermi 2 – can be used, in comparison to the period 1985-2008.
Table 8 below shows the Monroe County infant death rate (under 1 year old) compared to the U.S. rate for the pre-and post-startup period of Fermi 2.
Table 8 Death Rates, Infants <1, 1979-1984 vs. 1985-2008 Monroe County MI vs. United States
Rate (No. of Deaths)
Source: U.S. Centers for Disease Control and Prevention, http://wonder.cdc.gov. Rates represent number of deaths per 100,000 live births.
Monroe’s pre-Fermi infant death rate was 23.7% below the U.S., which has risen to 16.1% below thereafter. The increase fell short of being statistically significant (p<.29, when p<.05 is significant). In the most recent decade, the county rate was just 10.1% below the U.S., meaning the traditionally low county infant death rates is gradually approaching the national average, the longer the reactor operates.
Because of the great racial disparity in infant deaths, it would be helpful to examine the same changes for whites only, given in Table 9:
Table 9 Death Rates, Infants <1, 1979-1984 vs. 1985-2008, Whites Monroe County MI vs. United States
Rate (No. of Deaths)
Source: U.S. Centers for Disease Control and Prevention, http://wonder.cdc.gov. Rates represent number of deaths per 100,000 live births.
The increase in white Monroe County infant death rates from 18.6% to 3.7% below the
U.S. is sharper than that for all races. The rise falls short of statistical significance at p<.12. The county rate was actually 5.3% ABOVE the U.S. in the past decade (1999¬2008), changing a below-average infant death rate to an above-average one.
The fact that there are few Hispanics in Monroe County has little effect on infant death rates. The county infant death rate for non-Hispanic whites in the past decade is 2.5% greater than the U.S., based on 93 deaths.
Low Weight Births. Another means of measuring infant and fetal health is the percentage born under weight. Public health officials generally classify births below 2500 grams (5.5 pounds) as under weight, and those under 1500 grams (3.3 pounds) as very under weight.
The Michigan Department of Community Health web site displays annual birth weight data for each Michigan county and the state total, for each year from 1989-2009. Unfortunately, there are no data prior to Fermi’s opening in 1985, but using several years immediately following Fermi 2 started can be substituted for a baseline period. Table 10 below compares the county and the state of Michigan from 1989-1990 and 1991-2009, for low weight and very low weight births.
Table 10 Rates of Low Weight and Very Low Weight Births, 1989-1990 vs. 1991-2009 Monroe County MI vs. United States
Rate (No. Low Wt Births)
Very Low Weight Births 1989-1990 0.78 ( 30) 1.09 -49.3% 1991-2009 1.54 ( 367) 1.61 -32.5%
% Change +16.8% p<.12 (NS)
Source: Michigan Department of Community Health, www.michigan.gov/mdch, statistics and reports. Rates represent number of low weight births (<2500 grams) and very low weight births (<1500 grams) per 100 live births.
The county rate of births <2500 grams and <1500 grams both rose sharply, compared to the state of Michigan, since 1990. In the past two decades, the county rate is still below the state, but in recently there have been several years in which the county exceeded the state, suggesting again that the low rates in the county several decades ago are being replaced by higher ones.
The change for low weight births is highly significant (p<.002). In particular, the rate of very low weight births (<1500 grams) nearly doubled, from 0.78% to 1.54%, although it falls short of statistical significance (p<.12) due to the relatively small number of cases.
Childhood and Adolescent Cancer. Another expression of harm from radiation exposure early in life is cancer to the child and adolescent. Damaged fetal and infant cells may take years before manifesting as an actual cancer that is diagnosed. Childhood cancer may be the most-studied health measure after radiation exposure, as there are dozens of medical journal articles published on this topic.
The CDC mortality web site from 1979-2008 can be used to examine trends in Monroe County’s child and adolescent cancer rates. Child cancer incidence often uses age 0-19; because cancer deaths often take several years to occur, Table 11 can use cancer deaths age 0-24. Again, the period 1979-1984 (before Fermi 2) is used as a baseline, compared with the 24 years following.
Table 11 Cancer Death Rates Age 0-24, 1979-1984 vs. 1985-2008 Monroe County MI vs. United States
Rate (No. of Deaths) Period Monroe U.S. % Monroe vs. U.S. 1979-1984 3.699 ( 13) 4.889 -24.3% 1985-2008 4.444 ( 55) 3.470 +28.1%
% Change +52.4% p<.004
Source: U.S. Centers for Disease Control and Prevention, http://wonder.cdc.gov. Rates represent number of deaths from cancer per 100,000 persons. The ICD-9 codes used for the years 1979-1998 are 140.0¬208.9, and the ICD-10 codes used for 1999-2008 are C00-C97.9.
In the years prior to the startup of Fermi 2, the local cancer death rate age 0-24 was 24.3% below the U.S. But in the years following, the local rate rose, while the national rate declined. The county rate in the period 1985-2008 was 28.1% ABOVE the U.S., based on 55 deaths (significant at p<.004). Moreover, in the most recent decade (1999¬2008), the county rate was 50.2% higher (4.631 vs. 3.083 deaths per 100,000), suggesting rates are getting higher with time, and as the Fermi 2 reactor ages and its parts become more brittle.
Cancer in Young Adults. If children and adolescents are most sensitive to developing cancer from radiation exposure, it is a logical assumption that the next most sensitive group are young adults, defined in this analysis as age 25 to 44. CDC data on changes in Monroe vs. U.S. rates since Fermi 2 started up are presented in Table 12.
Table 12 Cancer Death Rates Age 25-44, 1979-1984 vs. 1985-2008 Monroe County MI vs. United States
Rate (No. of Deaths) Period Monroe U.S. % Monroe vs. U.S. 1979-1984 21.263 ( 49) 27.254 -22.0% 1985-2008 25.581 (262) 24.593 + 4.0%
% Change +26.0% p<.05
Source: U.S. Centers for Disease Control and Prevention, http://wonder.cdc.gov. Rates represent number of deaths from cancer per 100,000 persons. The ICD-9 codes used for the years 1979-1998 are 140.0¬208.9, and the ICD-10 codes used for 1999-2008 are C00-C97.9.
The county rate before Fermi 2 started up was 22.0% below the U.S., but has since been 4.0% above the U.S., based on 262 deaths from 1985-2008 (significant at p<.05). In the most recent decade of 1999-2008, Monroe’s rate was 8.4% greater (based on 103 deaths), indicating again that local rates are continuing to rise over time.
Cancer Mortality – Very Elderly. Aside from younger populations, the group that is most sensitive to damaging effects of radiation is the very elderly, whose immune systems are becoming weaker, making them less likely to fight off a carcinogen such as radiation.
Table 13 shows the change in cancer death rates for Monroe County residents age 75 and older, compared to the U.S., in the periods before and after Fermi 2 started up.
Table 13 Cancer Death Rates Age 75+, 1979-1984 vs. 1985-2008 Monroe County MI vs. United States
Rate (No. of Deaths) Period Monroe U.S. % Monroe vs. U.S. 1979-1984 1375.5 ( 376) 1318.7 + 4.3% 1985-2008 1505.7 (2462) 1412.08 + 6.6%
% Change + 2.3% p<.67
Source: U.S. Centers for Disease Control and Prevention, http://wonder.cdc.gov. Rates represent number of deaths from cancer per 100,000 persons. The ICD-9 codes used for the years 1979-1998 are 140.0¬208.9, and the ICD-10 codes used for 1999-2008 are C00-C97.9.
The Monroe County increase from 4.3% higher to 6.6% higher is not as dramatic as those larger increases for younger populations. The change is not statistically significant, but does represent a large number of deaths (2462 Monroe County residents age 75 and older died of cancer from 1985-2008). In the most recent decade (1999-2008), the county rate was 10.2% above the nation, suggesting that the increase is continuing in the Fermi 2 era.
Cancer Mortality – All Ages. The Monroe County and U.S. changes in cancer mortality for persons of all ages before and after Fermi 2 startup were also examined. These figures are adjusted to account for age distribution, a commonly used epidemiological method when examining populations of all ages. Table 14 indicates these changes.
Table 14 Cancer Death Rates All Ages, 1979-1984 vs. 1985-2008 Monroe County MI vs. United States
Rate (No. of Deaths) Period Monroe U.S. % Monroe vs. U.S. 1979-1984 211.27 (1231) 207.83 + 1.7% 1985-2008 213.25 (6540) 200.45 + 6.4%
% Change + 4.7% p<.14 (NS)
Source: U.S. Centers for Disease Control and Prevention, http://wonder.cdc.gov. Rates represent number of deaths from cancer per 100,000 persons, adjusted to the 2000 U.S. population. The ICD-9 codes used for the years 1979-1998 are 140.0-208.9, and the ICD-10 codes used for 1999-2008 are C00-C97.9.
Monroe County’s cancer death rate rose from 1.7% to 6.4% above the U.S. after Fermi 2 began operating. A total of 6540 deaths among county residents occurred in the 24-year period 1985-2008, but the change fell short of statistical significance at p<.l4. During the most recent decade (1999-2008), the county rate was 8.6% above the U.S., indicating that the increase is continuing. The racial mix doesn’t affect the rates much; in the period 1999-2008, the rate for non-Hispanic whites in Monroe County was 6.0% greater than the U.S., compared to 6.4% for all races.
The National Cancer Institute published a study in 1990 entitled “Cancer in Populations Living Near Nuclear Facilities.” The study examined cancer death rates near 62 U.S. nuclear plants in 5-year groups from 1950 to 1984, for all cancers combined and for 13 types of cancer. The study included statistics for Monroe County as that closest to the Fermi plant. Source: National Cancer Institute. Cancer in Populations Living Near Nuclear Facilities. NIH Pub. No. 90-874. Washington DC: U.S. Government Printing Office, 1990.
In the five-year period 1974-1978, after Fermi 1 had closed and before Fermi 2 had begun operating, the county mortality rate for all cancers combined was 11.3% below the U.S., based on 788 deaths. Thus, if this period was combined with 1979-1984, the Monroe cancer rate was below the U.S. – yet another example of a Monroe death rate below the nation before Fermi 2 was put into operation, only to approach or exceed the
U.S. after the reactor went critical.
Cancer Incidence, Most Common Cancers. While historical cancer mortality (death) data is available for the past 30 years for each state, such is not the case for cancer incidence (cases). Each state developed its cancer registry for newly-diagnosed cases at a different point in time, and thus the National Cancer Institute makes state-and county-specific incidence data available only for the period 2004-2008, making any historical trend analysis impossible.
However, the Michigan Department of Community Health makes annual county-specific cancer incidence data available on its web site beginning in 1985 and ending in 2007. All cancers combined are provided, along with the four most common malignancies (female breast, colorectal, lung, and male prostate), which make up about 55% of all diagnosed cases of cancer.
While there is technically no data prior to the startup of Fermi 2 in 1985, the period 1985¬1987 can serve as a “before startup” period, since most cancers that would be affected by emissions from Fermi 2 would occur at least two years after startup. Thus, Table 15 shows the changes in incidence for Monroe vs. the U.S., for the periods 1985-1987 and 1988-2007.
Table 15 Cancer Incidence Rates, All Ages, 1985-1987 vs. 1988-2007 Monroe County MI vs. United States
Rate (No. of Deaths) Period Monroe U.S. % Monroe vs. U.S. All Cancers Combined 1985-1987 268.5 ( 868) 456.1 -41.1% 1988-2007 434.7 (11514) 483.4 -10.1%
% Change +30.0% p<..000001
Female Breast Cancer
Colorectal Cancer 1985-1987 34.0 ( 104) 64.4 -47.3% 1988-2007 53.1 (1358) 54.6 -2.8%
% Change +44.5% p<..00001
Lung Cancer 1985-1987 52.5 ( 174) 66.1 -20.6% 1988-2007 75.0 (1977) 65.8 + 14.0%
% Change +34.6% p<..00001
Male Prostate Cancer 1985-1987 58.9 ( 61) 122.8 -52.0% 1988-2007 134.7 (1479) 177.5 -24.1%
% Change +27.9% p<..00002
Sources: Michigan Cancer Registry, http://www.michigan.gov/mdch/0,4612,7-132-2944_5323---,00.html (Monroe County data). Surveillance, Epidemiology, and End Results system (www.seer.cancer.gov, Cancer Statistics Registry, 1975-2008). U.S. rates consist of the states of Connecticut, Hawaii, Iowa, New Mexico, Utah, and the metropolitan areas of Atlanta, Detroit, San Francisco, and Seattle, Rates represent number of cancer cases per 100,000 persons, adjusted to the 2000 U.S. population.
For all cancers combined, and for each of the four most common cancers, the Monroe County incidence rate was below the U.S. in 1985-1987. All of the rates rose in the next 20-year period, although all are still below the U.S. (except for lung cancer, which is now 14% higher). The large numbers of cancer cases (11,514 in the 20 year period 1988¬2007) make the results for each of the five cancer types highly statistically significant.
Mortality, All Other Causes. Cancer is disease most strongly linked with the hazardous health effects of radiation exposure. However, the fact that radiation from nuclear reactors destroys and injures cells, impairing the immune system’s ability to fight disease can increase the risk of other conditions such as heart, digestive, and respiratory diseases.
Table 16 shows the change in Monroe vs. U.S. mortality rates for all causes of death except for cancer, for the pre-and post-Fermi 2 startup periods.
Table 16 Non-Cancer Death Rates All Ages, 1979-1984 vs. 1985-2008 Monroe County MI vs. United States
Rate (No. of Deaths) Period Monroe U.S. % Monroe vs. U.S. 1979-1984 814.84 (4441) 794.01 + 2.6% 1985-2008 703.03 (20507) 676.30 + 4.0%
% Change + 1.4% p<.41 (NS)
Source: U.S. Centers for Disease Control and Prevention, http://wonder.cdc.gov. Rates represent number of deaths from cancer per 100,000 persons, adjusted to the 2000 U.S. population. The ICD-9 codes used for the years 1979-1998 are all except 140.0-208.9, and the ICD-10 codes used for 1999-2008 are all except C00-C97.9.
The non-cancer death rate in Monroe County made a modest increase from 2.6% to 4.0% since Fermi 2 began operating, not significant at p<.41. The 4.7% excess for the most recent decade (1999-2008) was greater than the prior periods (2.6% for 1979-1984, and 3.3% for 1985-1998), showing a steady rise continuing into the most current period
Hospitalization Rate. The state of Michigan Department of Community Health also provides county-specific data on rates of hospital admissions for the period 2004-2008. While trend analysis is not possible, comparing Monroe County with the state may be indicative of potential health problems. Table 17 provides current hospitalization rates for all causes, plus cancer and birth defects, the conditions most closely connected with radiation exposure.
Table 17 Hospitalization Rates, 2004-2008, Selected Conditions Monroe County MI vs. Michigan
Rate (No. Hospitalizations) Period Monroe Mich. % Monroe vs. Mich. All Ages
All Causes 1399.2 (107,465) 1315.6 + 6.3% p<.000001
Malignant Cancer 43.7 (3360) 42.3 + 3.3% p<.68 (NS)
Benign neoplasms 20.4 (1570) 14.8 +37.8% p<.000001
Age <18 Congenital anomalies 10.8 ( 200) 10.4 + 3.8% p<.71 (NS)
Malignant cancer 3.2 ( 60) 2.5 +28.0% p<.18 (NS)
Source: Michigan Department of Community Health, www.michigan.gov/mdch, statistics and reports. Rates represent number of hospital admissions per 10,000 persons.
The hospitalization rate for Monroe County was 6.3% higher than the state for the period 2004-2008, which is significant due to the very large number of admissions (107,465). In 2009, the county rate of 1477.1 was 11.7% greater than the state rate of 1322.7 per 10,000 persons, based on 22,559 hospitalizations, signaling that the county-state gap may be growing.
Hospitalization rates for cancer – both malignant and benign – of all ages were greater in Monroe County vs. the state, as were rates for children under age 18 for cancer and congenital anomalies (birth defects). Of the five hospitalization measures here, two were statistically significant.
DISCUSSION
The proposed new Fermi 3 nuclear reactor raises a number of health concerns that should be addressed before any decision is made on whether to allow the reactor to be constructed. Assessing the potential environmental impact of Fermi 3 would be much more evidence-based if a “report card” on the performance of previous Fermi reactors, especially Unit 2, were part of the assessment. Unfortunately, the U.S. Nuclear Regulatory Commission does not require any such review, and thus, the EIS for Fermi 3 did not address the record of operations and health risks to the local population.
This report analyzes data on Fermi 2 in two areas: environmental contamination and trends in local health status. The environmental contamination section first addressed releases from a meltdown. Because of the 1966 meltdown at Fermi 1; the aging, corroding reactor at Fermi 2; and the reality that human error (Chernobyl), act of nature (Fukushima), and act of sabotage (if a terrorist attack struck a reactor) could cause a devastating meltdown at a plant with 4.8 million residents within 50 miles, the meltdown threat posed by a Fermi 3 is serious and should be strongly weighed in any decision on whether to allow its building.
The other type of radioactive contamination addressed in this report was that of emissions routinely released into the environment by Fermi 2. Several types of radioactive chemicals were examined, and in each, Fermi’s releases were greater than most U.S. nuclear reactors.
This report then examined trends in a variety of health status indicators since the 1980s, before and just after Fermi 2 came online. The Monroe County disease or death rate was compared to the state or national rate, for the “before” and “after” periods. The indicators were those believed to be most sensitive to radiation exposure, including infant deaths, low weight births, cancer mortality (all ages, children, young adults, and the very elderly), cancer incidence (all cancers, plus breast, colorectal, lung, and prostate cancer), plus hospitalization rates for cancer and birth defects.
For 19 of 19 indicators, the increase in the Monroe County rate exceeded the increase for the state or nation. Of these, 10 achieved statistical significance, with 4 others that approached significance. More analysis is merited here, but these strongly consistent findings should be taken seriously.
In closing, basic data on the performance of Fermi 2 places great doubt about whether Fermi 3 will pose a safety and health risk for local residents. Accordingly, the conclusion of this report is that no decision should be made on whether or not to approve a license for Fermi 3 until more research of this type is undertaken; a thorough public education and discussion process occurs; and that the majority of local people still approve of the new reactor with this additional knowledge.
JOSEPH J. MANGANO, MPH MBA 716 Simpson Avenue Ocean City NJ 08226 609-399-4343
PROFESSIONAL EXPERIENCE:
RADIATION AND PUBLIC HEALTH PROJECT, NEW YORK CITY Research Associate, 1989-2000; Executive Director, 2000-present. Expert on issues of health risks from exposure to radioactivity from nuclear weapons and reactors. Activities include:
1.Conducted research and published 27 medical journal articles, letters, and conference proceedings
2.Wrote 50 editorials, 20 letters to the editor, and 3 books
3.Directed study measuring radioactive Strontium-90 in baby teeth near nuclear plants
4.Led relations with elected officials, media, governing board, and advocacy groups
5.Participated in 23 press conferences on research findings
6.Provided written and spoken testimony to 19 government agencies
BOOKS:
Author, Radioactive Baby Teeth: The Cancer Link. Lightning Source, 2008. Author, Low-Level Radiation and Immune System Damage. CRC Press/Lewis, 1998. Co-author, The Enemy Within. Four Walls Eight Windows, 1996. Acknowledged in Deadly Deceit. Four Walls Eight Windows, 1990.
MAGAZINE ARTICLES (SELECTED):
"Nuclear Power Play," The Nation, April 10, 2000. “Reactors & Racism,” The Nation, August 15, 2005 (online version).
MEDIA COVERAGE (SELECTED NATIONAL):
"Study of Baby Teeth Sees Radiation Effects" The New York Times, December 14, 2010 “Thyroid Cancer” Fox News, March 8, 2009 CNN Saturday night news, March 5, 2005 “In Baby Teeth, A Test of Fallout,” The New York Times, November 11, 2003 “Baby Teeth Offer Radioactive Clues,” USA Today, January 2, 2004 “Nuclear Power Opponents Cite Link to Infant Death Rates,” The New York Times, April 30, 2002 “Eyeing Baby Teeth from the Cold War,” USA Today, January 29, 2002
NEWSPAPER OP-EDS (50):
"Radiation Too Easily Dismissed in Cancer Study" Asbury Park (NJ) Press, 1/18/02 “French Fries Don’t Give You Cancer” Pottstown (PA) Mercury, 2/14/05 “New Nukes Threaten Health in Illinois” Champaign (IL) News-Gazette, 1/15/06 “New Nuclear Reactors are a Threat to our Children’s Health” Durham (NC) Herald-Sun, 2/13/06 “Nuclear Energy Produces Health, Safety Risks” Richmond (VA) Times-Dispatch, 4/16/06 “Study Health of Neighbors of Millstone” New Haven (CT) Register, 5/23/06 “New South Texas Reactors: Build Them and Risks Will Come” Houston Chronicle, 7/22/06 “New Nuke Plants Hazardous to Amarillo’s Health” Amarillo (TX) Globe-News, 8/18/06 “Grand Gulf Raises Health Questions” Monroe (LA) News-Star, 8/20/06 “A New Nuclear Facility Would Pose Health Concerns” Spartanburg (SC) Herald-J, 8/20/06 “Would a New Grand Gulf Nuclear Plant Be Safe?” Jackson (MS) Clarion-Ledger, 11/12/06 “Ask Your Commission to Consider Health Before Endorsing Plant” Idaho Statesman, 12/10/06 “The Danger of Storing Nuclear Waste” Pottstown (PA) Mercury, 12/16/06 “A New Plant on the Horizon? Weighing Risks” Orlando (FL) Sentinel, 12/22/06 “Pilgrim Nuclear Plant’s Cancer Menace” Providence (RI) Journal, 3/27/07
“Oyster Creek Regulators Can’t Ignore Health Risks” Asbury Park (NJ) Press, 7/18/07 “For Safety’s Sake, Shut Down Oyster Creek” Newark (NJ) Star-Ledger, 8/8/07 “Nuke Plants in Utah Would Pose Public Health Risk” Salt Lake City (UT) Tribune, 8/26/07 “VY: Clear and Present Danger?” Brattleboro (VT) Reformer, 9/14/07 “Nuclear Reactor an Unclean, Dangerous Source for Energy” Spfld. (MO) News-Leader, 9/22/07 “Oyster Creek: Safety First” Trenton (NJ) Times, 9/28/07 “Don’t Keep Old Nuclear Plant Open in Ocean” Parsippany (NJ) Daily Record, 10/6/07 “Demand Answers on Cancer Causes” Ocean County (NJ) Observer, 10/24/07 “State Should Look to Truly Clean Energy Sources” Milwaukee (WI) Journal Sentinel, 10/30/07
“Demand Answers on Cancer Causes” Chattanooga (TN) Times Free Press, 11/25/07 “Nuclear Energy and a New Hampshire Cancer Spike” Keene (NH) Sentinel, 3/6/08 “Coal for Nukes: Replacing One Hazard with Another” Louisville (KY) Courier Journal, 3/11/08
“Too Much Cancer Already – New Nukes a Big Risk” Victoria (TX) Advocate, 8/8/08 “Fermi Celebration Ignores Health Risks” Monroe (MI) Sunday News, 9/7/08 “Reactor a Potential Health Risk” Annapolis (MD) Capital, 11/25/08
“Resolve Health Issues Before Building More Reactors” Scranton (PA) Times Tribune, 12/3/08
“Weigh All Health Risks Before Allowing a New Reactor” Syracuse Post Standard, 3/19/09 “Nuclear Power Not Clean” Charleston (WV) Gazette, 3/25/09 “Health Threat of Perry Nuclear Power Plant Should be Studied” Cleveland Plain Dealer, 4/5/09 “Nuclear Power Would be Bad Policy for State” Oklahoma City Journal Record, 4/22/09 “Health Threat of Nuclear Plant Should be Studied” Portsmouth (OH) Daily Record, 7/2/09 “We’ve Had Enough of Indian Point” Kingston (NY) Daily Freeman, 9/1/09 “Aging Indian Point Plant Should Be Shut Down” Bergen (NJ) Daily Record, 9/4/09 “Salem Nukes Pose Risks for Cumberland County” Cumberland (NJ) Reminder, 9/16/09 “Old Nuclear Plants Threaten Delaware” Wilmington (DE) News Journal, 10/5/09 “Indian Point Nukes Threaten Connecticut” Stamford (CT) Advocate, 10/7/09 “Indian Point Nukes Threaten Connecticut” Greenwich (CT) Time, 10/7/09 “Indian Point Puts Public Health at Grave Risk” Albany (NY) Times Union, 11/10/09 “Indian Point a Likely Contributor to High Cancer Rate” Putnam (NY) News and Recorder, 12/9/09 “Nuclear Power Wrong Answer to State Energy Needs” Frankfort (KY) State Journal, 3/21/10 “New Nukes in Fresno Would Endanger Public Health” Fresno (CA) Community Alliance, 4/10 “Health Threat at Diablo” Ventura County (CA) Star, 4/16/10 “Oyster Creek Tritium Risk Review Needed” Asbury Park (NJ) Press, 6/13/10 “Should Seabrook Station’s License Be Extended 20 Years?” Nashua (NH) Telegraph, 6/13/10 "Yankee's Health Risks" Greenfield (MA) The Recorder, 11/3/10
NEWSPAPER LETTERS TO THE EDITOR (20):
“New Reactor Would Pose Health Risk” Toledo (OH) Blade, 3/28/07 “It is Time to Study All Nuclear Risks” Tuscaloosa (AL) News, 5/31/07 “Nuclear Health Risks” The Huntsville (AL) Times, 6/5/07 “Study Health Risks Before Proposing New Reactors” The Palm Beach (FL) Post, 6/18/07
3
“Indian Point Poses Health Threats” Westchester (NY) Journal News, 11/19/07 “Nuclear Plants Aren’t Worth Risk” Atlantic City (NJ) Press, 12/3/07 “New Nuclear Plants Create Health Risk” The State, Columbia (SC), 5/31/08 “Nuclear Risks” The Stamford (CT) Advocate, 6/6/08 “Nuclear Reactor Needs ‘Precautionary Principle’” Asbury Park (NJ) Press, 11/30/08 “Closing Indian Point a Public Health Issue” Westchester (NY) Journal News, 2/19/09 “Any Radiation is Hazardous” Pottstown (PA) Mercury, 4/6/09 Response to “State Responds to Lake County Cancer Stats” Cleveland Plain Dealer, 8/16/09 “Indian Point: A Cancer Risk Too Close for Comfort” Woodstock (NY) Times, 12/3/09 “Evidence vs. Slogans” Putnam County (NY) News and Recorder, 12/16/09 “Half Truth About NFS” Johnson City (TN) Press, 12/16/09 "Nuke Plant May Be Hazardous" West Valley (AZ) View, 8/27/10 "Rep. John Salazar is Wrong on Nuclear Energy" Grand Junction (CO) Sentinel, 8/31/10
"Give Report Another Look" Rutland (VT) Herald, 10/5/10 "Nuclear Power Not Just Costly, But Also Unsafe" Baltimore (MD) Sun, 10/28/10 "Vermont Yankee Causes Harm" Bennington (VT) Banner, 11/1/10
LETTERS TO THE NEW YORK TIMES:
"Radiation as Carcinogen," New York Times, 10/3/97. "Why Was Government Silent on Bomb Tests?" New York Times, 8/3/97. "Potassium Iodide Is No Protection from Fallout," New York Times, 4/10/96.
HUFFINGTON POST ESSAYS:
"Nuclear Power Causes Cancer: What Industry Doesn’t Want You to Know.” Written with Samuel Epstein MD, August 4, 2009.
"Reflecting on the 65th Anniversary of the First A-Bomb." Written with Samuel Epstein MD, July 16, 2010.
"Nuke Accident Would Dwarf Oil Spill." Written with Samuel Epstein MD, August 2, 2010.
MEDICAL JOURNAL ARTICLES, author or co-author (17):
"An Unexpected Mortality Increase in the United States Follows Arrival of the Radioactive Plume from Fukushima: Is There a Correlation?" International Journal of Health Services, Winter 2012.
“Elevated In Vivo Strontium-90 from Nuclear Weapons Test Fallout Among Cancer Decedents: A Case-Control Study Using Deciduous Teeth.” International Journal of Health Services, Winter 2011.
“Geographic Variations in U.S. Thyroid Cancer Incidence and a Cluster Near Nuclear Reactors in New Jersey, New York, and Pennsylvania,” International Journal of Health Services, Fall 2009.
"Excess Mortality After Startup of a Nuclear Power Plant in Mississippi," International Journal of Health Services, Spring 2008.
“A Short Latency Between Radiation Exposure From Nuclear Plants and Cancer In Young Children,”
4
International Journal of Health Services, Winter 2006. "Three Mile Island: Health Study Meltdown," Bulletin of the Atomic Scientists, Summer 2004. "An Unexpected Rise in Strontium-90 in U.S. Deciduous Teeth in the 1990s," The Science of the Total
Environment, Winter 2004.
"Elevated Childhood Cancer Incidence Proximate to U.S. Nuclear Power Plants," Archives of Environmental Health, Spring 2003. "Infant Death and Childhood Cancer Reductions After Nuclear Plant Closing in the U.S.," Archives of
Environmental Health, Spring 2002.
“Strontium-90 in Baby Teeth as a Factor in Early Childhood Cancer,” International Journal of Health Services, Fall 2000. “Strontium-90 in Newborns and Childhood Disease,” Archives of Environmental Health, Fall 2000. “Improvements in Local Infant Health After Nuclear Power Reactor Closing,” Journal of Environmental
Epidemiology and Toxicology, Spring 2000. "The Strontium-90 Baby Teeth Study and Childhood Cancer," Euro. Journal of Oncology, Fall 2000. "A Rise in the Incidence of Childhood Cancer in the U.S.," International Journal of Health Services,
Spring 1999.
"A Post-Chernobyl Rise in Thyroid Cancer in Connecticut," European Journal of Cancer Prevention, Winter 1996. "Cancer Mortality Near Oak Ridge, Tennessee," Inter. Journal of Health Services, Summer 1994. “Cancer in Baseball Players: A New Outbreak?” Pesticides, People, and Nature, Summer 2000.
LETTERS TO MEDICAL JOURNALS (6):
“Childhood Leukemia Near U.S. Nuclear Plants,” European Journal of Cancer Care, Summer 2008. "Answering the Challenge," (response to Sen. Domenici), Bull. of the Atomic Scientists, Summer 1998. "Low-Level Radiation Harmed Humans Near Three Mile Island," Environmental Health Perspectives,
Summer 1997. "Childhood Leukaemia in U.S. May Have Risen Due to Fallout From Chernobyl," BMJ, Spring 1997. "Chernobyl and Hypothyroidism," Lancet, Spring 1996 and Summer 1996 (response to comment). "Thyroid Cancer in the United States Since Accident at Chernobyl," BMJ, Summer 1995
5
CONFERENCE PROCEEDINGS (4):
“Elevated Cancer Rates Near U.S. Nuclear Plants.” In Busby C (ed). Criticisms and Developments in the Assessment of Radiation Risk. Aberystwyth, Wales: European Commission on Radiation Risk, 2009.
"Chernobyl Emissions Linked to a Variety of Adverse Health Effects in the U.S." In Kohnlein W and Nussbaum R (eds.): Effects of Low Dose Ionizing Radiation. Muenster: German Society for Radiation Protection, 1998.
"Health Effects of Low Dose Exposure to Fission Products from Chernobyl and the Fermi Nuclear Reactor in the Population of the Detroit Metropolitan Area." In Kohnlein W and Nussbaum R (eds.): Effects of Low Dose Ionizing Radiation. Muenster: German Society for Radiation Protection, 1998.
"Low Level Radiation and Carcinoma of the Thyroid." In Schmitz-Feuerhake I and Lengfelder E (eds.):100 Jahre Roentgen: Berlin: German Society for Radiation Protection, 1995.
PRESS CONFERENCES (23):
-Washington DC, 4/00 -White Plains NY, 11/00 and 10/02 -Valhalla NY, 8/03 -Pottstown PA, 1/01, 11/03, 4/05, 5/06 -Toms River NJ, 5/00 and 4/01 -Mineola NY, 6/01 -New York City, 7/99, 4/02, 11/07, and 11/09 -Trenton NJ, 5/03, 3/06, 6/07 -Hackensack NJ, 11/03 -Harrisburg PA, 8/04, 11/05 -Westport CT, 5/08 -Philadelphia PA, 1/10
TESTIMONY TO GOVERNMENT OFFICIALS (19):
-New York State energy advisory group (NYSERDA), 4/02 -New York City Council (Indian Point NY plant), 5/02 and 2/03 -U.S. Nuclear Regulatory Commission (Harris NC plant), 7/07 -U.S. Nuclear Regulatory Commission (Oyster Creek NJ plant), 7/06, 5/07 -U.S. Nuclear Regulatory Commission (Peach Bottom PA plant), 7/02 -U.S. Nuclear Regulatory Commission (Turkey Point FL plant), 7/01 -Connecticut State utility commission, (Millstone CT plant) 11/00 -U.S. Senate Environment Committee (Sen. Hillary R. Clinton), 6/01 -Suffolk County (NY) legislature, Sr-90 in baby teeth, 8/00 -Suffolk County (NY) Rhabdomyosarcoma task force, 2001-3 -Westchester County (NY) legislature, Sr-90 in baby teeth 11/00, 10/02 -New Jersey Commission on Radiation Protection, 2/05, 6/07 -New Jersey Department of Environmental Protection, 2/10 -Ocean County (NJ) Board of Freeholders, 9/07
EDUCATION:
MBA in Management, Fordham University, New York NY, 1985 MPH in Health Administration, University of North Carolina, Chapel Hill NC, 1978 BA in Political Science, North Carolina State University, Raleigh NC, 1976
POTENTIAL HEALTH RISKS POSED BY ADDING A NEW REACTOR AT THE FERMI PLANT
Radioactive contamination from Fermi 2 and changes in local health status
Joseph J. Mangano, MPH MBA
Executive Director
Radiation and Public Health Project
January 10, 2012
TABLE OF CONTENTS
Executive Summary. . . . . . . . . . . . . . . . . . . . . . . . . . . . . . . . . . 3
Introduction. . . . . . . . . . . . . . . . . . . . . . . . . . . . . . . . . . . . . . 4
Radiation Contamination Produced by Fermi – Actual and Potential. . . . . . . . . 6
Demographics-Area Closest to Fermi . . . . . . . . . . . . . . . . . . . . . . . . 10
Local Levels of Radiation Sensitive Health Indicators Since Startup of Fermi 2. . . 12
Discussion . . . . . . . . . . . . . . . . . . . . . . . . . . . . . . . . . . . . . . .21
EXECUTIVE SUMMARY
In November 2008, Detroit Edison submitted an application to the U.S. Nuclear Regulatory Commission (NRC) for a new nuclear reactor (Fermi 3) in southeast Michigan. In October 2011, an Environmental Impact Statement (EIS) was released for public comment, and the following report addresses issues of environmental impact.
Even though it mandates a lengthy process before deciding on whether to grant a license to the proposed new reactor, the NRC has no provision mandating that the utility produce evidence demonstrating the safety of the new unit. Neither was addressed in the EIS, other than to conclude (without empirical evidence) that the potential for meltdown would be extremely small, and that routine radioactive releases into the environment would not harm local residents. This report provides a basic “report card” of operations at Fermi 2 as a means to help evaluate safety and health issues posed by Fermi 3.
Contamination from Fermi 2 – both potential and actual – are multiple and concerning. The chance of a meltdown at a nuclear reactor is all too real. Prior meltdowns from human error at places like Three Mile Island and Chernobyl have been augmented by the 9/11 attacks in 2001, which created a real threat of a meltdown from acts of sabotage, and by the 2011 earthquake and tsunami in Japan, which caused meltdowns at four reactors at the Fukushima plant. Fermi 2 has had several events that raised the possibility of a meltdown in the past decade. With a population of 4.8 million living within 50 miles of the plant, a meltdown would be catastrophic for the Detroit area, along with parts of Ohio and Canada.
Like all reactors, Fermi 2 has routinely emitted radiation into the local air since it began operating at low power in June 1985 and full power in January 1988. NRC data suggest that emission levels have been higher at Fermi than for most U.S. reactors.
Analyses were conducted on changes in the Monroe County (vs. the U.S. or Michigan) rates of diseases and deaths known to be especially susceptible to radiation exposure since the 1980s (before and just after Fermi 2 startup). Of 19 indicators, the Monroe County rate change exceeded the state or nation for all 19, with 10 of them statistically significant and 4 others approaching significance. These indicators included:
-Infant deaths
-Low weight births
-Cancer mortality for all ages, plus children, young adults, and the very elderly
-Cancer incidence for all cancers, plus breast, colorectal, lung, and prostate
-Mortality for all causes other than cancer
-Hospitalization rates for all causes, cancer, and birth defects
More analysis is merited here, but these strongly consistent findings should be taken seriously. This report concludes that no decision should be made on whether or not to approve a license for Fermi 3 until more research of this type is undertaken; a thorough public education and discussion process occurs; and that the majority of local people still approve of the new reactor with this additional knowledge.
INTRODUCTION
The Fermi nuclear plant is located on Lake Erie, in Monroe County Michigan, about 26 miles south of Detroit. The table below shows Fermi has been the site of two operating nuclear reactors; Fermi 1 closed in 1972, while Fermi 2 is still in operation. A new Fermi 3 reactor was ordered in 1972, but cancelled two years later (Table 1). The current proposed Fermi 3 is a different project and design than the 1972 proposal.
Table 1
Reactors Ordered at the Fermi Nuclear Plant
Reactor Megawatts Application Went Critical Closed
Fermi 1 61 6/ 1/56 8/23/63 9/22/72
Fermi 2 1065 7/26/68 6/21/85
Fermi 3 1171 1/ 1/72 Never Built
Source: U.S. Nuclear Regulatory Commission, www.nrc.gov
In November 2008, Detroit Edison Company proposed building a new Fermi 3 Economic Simplified Boiling Water Reactor of 1560 megawatts electrical/4680 megawatts thermal at the site, and is seeking a “Combined Operating License” from the U.S. Nuclear Regulatory Commission (NRC). The NRC prepared a draft Environmental Impact Statement (EIS) in October 2011, a legal mandate as part of the process of considering whether or not to grant approval for the development of Fermi 3.
This report will examine whether the EIS sufficiently addressed two subjects, i.e. the potential contamination from a new Fermi 3, and potential health risks of this contamination to local residents.
The contamination from reactors such as those at Fermi involves a process known as fission, which occurs when Uranium-235 is bombarded by neutrons. (Before this point, U-235 must be mined, milled, converted, enriched, and fabricated). This is exactly the same process in an atomic bomb explosion, except that the process in nuclear reactors is controlled.
As uranium atoms split, neutrons strike other U-235 atoms, causing a chain reaction in which extremely high heat is created. Breaking U-235 atoms apart also creates several hundred new chemicals, known as fission and activation products. They are not found in nature, but formed by the re-arrangement of protons, neutrons, and electrons from the old U-235 atoms.
Some of these chemicals have become well known during the atomic era of the past 65 years, including Iodine-131, Cesium-137, and Strontium-90. Despite efforts by reactor operators to contain these chemicals within the reactor building, some must be routinely emitted into the air and water, during daily operations and refueling. These metal particles and gases are returned to the earth through precipitation. They enter the human body by breathing and the food chain, where they kill and injure cells by emitting alpha particles, beta particles, or gamma rays. A damaged cell may or may not repair itself; if it fails to do so, it will duplicate into similarly damaged cells, which can lead to mutations and cancer.
While all humans are harmed by fission products, the fetus, infant, and child are most affected. Adult cell division is relatively slow, giving a damaged cell a better chance for repair. But fetal and infant cells divide at a very rapid rate, making repair of the damage less likely. The fetal and infant immune system is also relatively immature, making it less likely to fight off mutations that can become cancer.
The cocktail of over 100 chemicals attacks various parts of the body. Radioactive iodine attaches to the thyroid gland. Strontium seeks out bone and teeth, and penetrates into the bone marrow. Plutonium enters the lung. Cesium disperses throughout the muscles. Thus, exposure to the mix of radioactive elements can raise risk of many diseases, not just bone or thyroid cancer.
RADIOACTIVE CONTAMINATION PRODUCED BY FERMI –
ACTUAL AND POTENTIAL
Possibility of Meltdowns. The radioactivity produced by nuclear reactors like those at Fermi can be released into the environment, and thus into human bodies, in large amounts (via a meltdown) or smaller amounts (via routine releases or deliberate releases). The EIS does not adequately address potential and actual radioactive emissions from Fermi. It minimizes the chance of a meltdown, which can occur from human error (like Chernobyl or Three Mile Island), act of sabotage (terrorist organizations have been known to target U.S. reactors), or act of nature (like Fukushima). In addition, human error (along with mechanical problems) accounted for a partial meltdown at Fermi 1 in 1966, which came dangerously close to a huge environmental release of radioactivity.
In 1982, Sandia National Laboratories reported to Congress the number of humans that would be affected by a worst-case meltdown near each U.S. nuclear plant. The figures for a meltdown at Fermi 2 included 8,000 deaths from acute radiation poisoning and 13,000 cancer deaths within 15 miles, along with 340,000 non-fatal cases of acute radiation poisoning within 70 miles. The figure of 340,000 is the highest of any U.S. reactor except for Limerick, located near Philadelphia. (Calculation of Reactor Accident Consequences, or CRAC-2, reported to the House Committee on Interior and Insular Affairs Subcommittee on Oversight and Investigations, November 1, 1982).
Although any meltdown would have devastating consequences, such an event at Fermi 2 would be especially harmful. According to 2010 U.S. Census data, while just 92,377 persons live within 10 miles of the plant, 4,799,526 live within 50 miles, including the metropolitan areas of Detroit MI, Toledo OH, and Windsor Canada. (Source: Dedman B. Nuclear neighbors: Population rises near US reactors, msnbc.com, April 14, 2011. http://www.msnbc.msn.com/id/42555888/ns/us_news-life/. Accessed January 10, 2012).
The recent devastation at Fukushima just 10 months ago is a tragic reminder that the risk of a meltdown is all too real, and should be a major consideration when evaluating whether to bring new nuclear reactors on line.
Aging Reactors Operating Most of Time. For years, U.S. nuclear reactors operated barely half the time, due to frequent mechanical problems. But beginning in the late 1980s, utilities made upgrades that reduced shut down time, even correcting mechanical flaws while reactors continued to operate. In addition, “refueling” nuclear reactors is now done much less often (about every 18 months), and the time that a reactor is shut down for refueling, a complex process, has been greatly reduced, to several weeks.
While this practice is a positive one from a financial point of view, it raises concerns from a health standpoint. Reactors are aging – virtually all are at least 25 years old – and their parts are becoming increasingly brittle and susceptible to breakdown. The practice of keeping reactors in operation more of the time is akin to driving an old car with many miles on it increasingly long distances.
Table 2 shows that the Fermi 2 plant operated 91.0% of the time from 2000-2005, a figure roughly equal to the national rate. The U.S. Nuclear Regulatory Commission stopped publishing monthly hours of operation on its web site several years ago; but even though exact figures are not known, it is highly likely that post-2005 capacity is similar to the prior several years.
A high capacity factor increases the probability of meltdowns. It also increases the likelihood of routine emissions of radioactivity escaping into the environment.
Table 2
Percent Capacity (% of time in operation)
Fermi 2 Reactor, 2000-2005
YearHrs. CriticalTotal Hrs.% Capacity
20007696.5878487.6
20017967876090.9
20028646876098.7
20037614876086.9
20047905878490.0
20058032.8876091.7
TOTAL47861.35260891.0
Source: U.S. Nuclear Regulatory Commission, www.nrc.gov.
Near Miss Accidents. In 2006, the group Greenpeace published an analysis of “near miss” meltdowns at U.S. nuclear reactors in the 20 years since Chernobyl. There were 200 such events on the list, and two occurred at Fermi 2. On January 28, 2001, the reactor’s emergency diesel generator was inoperable for more than seven days. On August 14, 2003, the reactor experienced a loss of offsite power due to the blackout in the northeast U.S. (Source: An American Chernobyl: Nuclear “Near Misses” at U.S. Reactors Since 1986, www.greenpeace.org).
Shut Downs for Over a Year. Also in 2006, the Union of Concerned Scientists published a list of U.S. nuclear reactors that had been closed for at least a year. One was Fermi 1, which was closed from October 5, 1966, when it experienced a partial meltdown, and did not re-start until July 18, 1970. The reactor operated very little thereafter, and closed permanently two years later.
The other long outage occurred at Fermi 2, from December 25, 1993 to January 18, 1995, a total of 13 months. (Source: Union of Concerned Scientists: Unlearned Lessons from Year-Plus Reactor Outages, www.ucsusa.org).
Actual Emissions. Each utility company operating a nuclear reactor is required by law to measure actual emissions of various types of radioactivity into the environment. There are various chemicals included in these reports, but several show that Fermi 2 may be among the reactors with the greatest emissions in the U.S.
One type of chemical reported is Iodine-131, produced only in nuclear reactors and weapons tests. In the year 2002, for example, Fermi 2 released the 10th highest amount of I-131 into the air, out of 68 reactors with reported emissions. The Fermi total of 9,280 microcuries of I-131 was far above the median of 496 for the 68 reactors (Table 3). I-131 has a half life of 8 days, and seeks out the thyroid gland, where it destroys and injures cells.
Table 3
U.S. Reactors with Greatest Emissions of Airborne I-131, 2002
(Total 68 Reactors, Medican Microcuries = 496)
ReactorMicrocuries
1. LaSalle 1 IL 316000
2. Browns Ferry 1 AL 275000
3. Vogtle 1 GA 20500
4. San Onofre 2 CA 17300
5. Salem 2 NJ 16500
6. Oyster Creek NJ 13700
7. Fort Calhoun NE 10900
8. Brunswick 1 NC 10300
9. Palo Verde 2 AZ 9740
10. Fermi 2 MI 9280
Source: U.S. Nuclear Regulatory Commission, Radiation Exposure Information and Reporting System (www.reirs.comm/effluent).
In addition, Fermi 2 released a relatively high total of Strontium-89 into the air in 2002. Its total of 418 microcuries ranked 7th highest of 33 reactors with reported releases, and its total was far above the national median of 36 microcuries (Table 4). Radioactive strontium seeks out bone and penetrates into the bone marrow, where the white blood cells so important to the immune system are formed. Sr-89 has a half life of 50 days.
Table 4
U.S. Reactors with Greatest Emissions of Airborne Sr-89, 2002
ReactorMicrocuries
1. Oyster Creek NJ8630
2. LaSalle 1 IL7350
3. Cooper Station IL1980
4. Quad Cities 1 IL1850
5. Dresden 2 IL 986
6. Nine Mile Point 1 NY 655
7. Fermi 2 MI 418
8. Browns Ferry 1 AL 355
9. Vermont Yankee VT 281
10. River Bend LA 199
Source: U.S. Nuclear Regulatory Commission, Radiation Exposure Information and Reporting System (www.reirs.com/effluent).
There is also evidence that Fermi 2 emissions are relatively high for periods more recent than 2002. Table 5 shows the volume of gaseous emissions of tritium during 2007 from U.S. nuclear plants. Of the 60 plants with reporting data, Fermi ranks 13th highest. Its total of 124.60 curies ranks well above the U.S. median of 55.23.
Table 5
U.S. Nuclear Plants with Greatest Emissions of Airborne Tritium, 2007
(Total 60 Plants, Median Curies = 55.23)
PlantCuries
1. Palo Verde AZ1934.7
2. Hope Creek/Salem 1-2 NJ 414.1
3. Cook 1-2 MI 291.4
4. Brunswick 1-2 NC 256.0
5. Harris NC 235.9
6. McGuire 1-2 NC 204.3
7. Diablo Canyon 1-2 CA 193.7
8. Catawba 1-2 SC 187.9
9. Nine Mile Point 1-2 NY 158.1
10. St. Lucie 1-2 FL 138.1
11. Waterford LA 131.8
12. Sequoyah 1-2 TN 131.2
13. Fermi 2 MI 124.6
Source: U.S. Nuclear Regulatory Commission, Radiation Exposure Information and Reporting System (www.reirs.comm/effluent).
Gaseous tritium emissions appear to be rising over time. Table 6 shows the amount of reported emissions for each year from 2001 to 2007. Although not all quarterly reports showed actual emissions, it still appears that levels are rising over time.
Table 6
Gaseous Tritium Releases, by Year, 2001-2007, Fermi 2 Plant
YearReportedCuries
2001 1 1.31
2002 2 1.23
2003 3 23.66
2004 4101.50
2005 0 ----
2006 4111.30
2007 4124.60
Source: U.S. Nuclear Regulatory Commission, Radiation Exposure Information and Reporting System (www.reirs.comm/effluent).
DEMOGRAPHICS - AREA CLOSEST TO VOGTLE
Fermi is located in southeastern Monroe County, which means that all residents live within 20 miles of the Fermi plant, and the majority of residents live within 10 miles. Because of this proximity, and because the National Cancer Institute 1990 study of cancer near nuclear plants selected Monroe County as the “local” area closest to Fermi, this study will also use the county as the focal area of analysis.
There are limits by using the county as the study area. Prevailing winds tend to blow towards the east, i.e. into Lake Erie, and thus local residents may not absorb the greatest doses of radioactivity released from Fermi. Using the entire county does not examine whether there are health differences in Monroe County populations closest to Fermi vs. those further away – essentially because of the difficulty in obtaining sub-county health data. However, winds swirl, propelling Fermi radioactivity not just to the east, but to the west, north, and south. The municipal water supply is located very close to Fermi. And fish caught in Lake Erie are most likely to be consumed by local residents. For these reasons, Monroe County should be a relatively meaningful area
Demographic characteristics of Monroe County, compared to the state and nation, are given in Table 7 below:
Table 7
Demographic Characteristics, Monroe County vs. Michigan vs. U.S.
CategoryMonroeMichiganUnited States
2010 population152,0219,883,640308,745,538
2010 % < 18 years24.123.724.0
2010 % > 65 years13.413.813.0
2010 % Female50.750.950.8
2010 % White94.478.972.4
2010 % Black 2.114.212.6
2010 % Asian 0.6 2.4 4.8
2010 % Hispanic 3.1 4.416.3
2010 % White non-Hisp.92.576.663.7
2005-09 % Foreign born 1.9 6.012.4
2005-09 % High School grad87.787.484.6
2005-09 % College grad17.124.527.5
2009 % Below Poverty10.716.114.3
2009 Median Household Inc.$53,224$45,254$50,221
Note: Percent high school and college graduates are for adults over age 25. Source: U.S Bureau of the Census, www.census.gov, state and county quick facts.
With a population just over 150,000, Monroe County is similar to the state and nation in terms of gender and age distribution. The proportion of residents that are minorities is much lower in Monroe, as is the percent of foreign born. The percent of college graduates is low, but so is the percent living below poverty.
While there are differences in demographics between Monroe compared to Michigan and the United States, these differences have existed for many years. Therefore, temporal trends over time are appropriate when comparing Monroe County to the state and nation.
This report will examine changes in health status before and after the startup of Fermi 2, using official data from a variety of health indicators.
LOCAL TRENDS IN RADIATION-SENSITIVE HEALTH INDICATORS SINCE STARTUP OF FERMI 2 REACTOR
Infant Deaths. The segment of the population that is most susceptible to the damage inflicted by radiation exposure is the fetus and infant. The very young have immature immune systems; and their cells are dividing so rapidly compared to adults there is less of a chance that a fetal/infant cell damaged by radiation can self-repair before dividing – into more damaged cells.
Data are available for several types of infant and fetal health indicators at the county level. The first is infant deaths, which is one of the more commonly used indicators of a society’s health. Annual infant deaths and death rates for each U.S. county is available from the U.S. Centers for Disease Control and Prevention, for the 30 year period 1979 to 2008. This means a baseline period of 1979-1984 – after the shut down of Fermi 1 and before the startup of Fermi 2 – can be used, in comparison to the period 1985-2008.
Table 8 below shows the Monroe County infant death rate (under 1 year old) compared to the U.S. rate for the pre- and post-startup period of Fermi 2.
Table 8
Death Rates, Infants <1, 1979-1984 vs. 1985-2008
Monroe County MI vs. United States
Rate (No. of Deaths)
PeriodMonroeU.S.% Monroe vs. U.S.
1979-1984903.1 (110)1183.5- 23.7%
1985-2008672.0 (293) 801.2- 16.1%
% Change+ 7.6% p<..29 (NS)
Source: U.S. Centers for Disease Control and Prevention, http://wonder.cdc.gov. Rates represent number of deaths per 100,000 live births.
Monroe’s pre-Fermi infant death rate was 23.7% below the U.S., which has risen to 16.1% below thereafter. The increase fell short of being statistically significant (p<.29, when p<.05 is significant). In the most recent decade, the county rate was just 10.1% below the U.S., meaning the traditionally low county infant death rates is gradually approaching the national average, the longer the reactor operates.
Because of the great racial disparity in infant deaths, it would be helpful to examine the same changes for whites only, given in Table 9:
Table 9
Death Rates, Infants <1, 1979-1984 vs. 1985-2008, Whites
Monroe County MI vs. United States
PeriodMonroeU.S.% Monroe vs. U.S.
1979-1984831.4 ( 99)1021.3- 18.6%
1985-2008643.8 (271) 668.5- 3.7%
% Change+14.9% p<.12 (NS)
Source: U.S. Centers for Disease Control and Prevention, http://wonder.cdc.gov. Rates represent number of deaths per 100,000 live births.
The increase in white Monroe County infant death rates from 18.6% to 3.7% below the U.S. is sharper than that for all races. The rise falls short of statistical significance at p<.12. The county rate was actually 5.3% ABOVE the U.S. in the past decade (1999-2008), changing a below-average infant death rate to an above-average one.
The fact that there are few Hispanics in Monroe County has little effect on infant death rates. The county infant death rate for non-Hispanic whites in the past decade is 2.5% greater than the U.S., based on 93 deaths.
Low Weight Births. Another means of measuring infant and fetal health is the percentage born under weight. Public health officials generally classify births below 2500 grams (5.5 pounds) as under weight, and those under 1500 grams (3.3 pounds) as very under weight.
The Michigan Department of Community Health web site displays annual birth weight data for each Michigan county and the state total, for each year from 1989-2009. Unfortunately, there are no data prior to Fermi’s opening in 1985, but using several years immediately following Fermi 2 started can be substituted for a baseline period. Table 10 below compares the county and the state of Michigan from 1989-1990 and 1991-2009, for low weight and very low weight births.
Table 10
Rates of Low Weight and Very Low Weight Births, 1989-1990 vs. 1991-2009
Monroe County MI vs. United States
PeriodMonroeMich.% Monroe vs. Mich.
Low Weight Births
1989-19905.14 ( 198)6.69- 32.2%
1991-20096.69 (2264)7.98- 16.1%
% Change+16.1% p<.002
Very Low Weight Births
1989-19900.78 ( 30)1.09- 49.3%
1991-20091.54 ( 367)1.61- 32.5%
% Change+16.8% p<.12 (NS)
Source: Michigan Department of Community Health, www.michigan.gov/mdch, statistics and reports. Rates represent number of low weight births (<2500 grams) and very low weight births (<1500 grams) per 100 live births.
The county rate of births <2500 grams and <1500 grams both rose sharply, compared to the state of Michigan, since 1990. In the past two decades, the county rate is still below the state, but in recently there have been several years in which the county exceeded the state, suggesting again that the low rates in the county several decades ago are being replaced by higher ones.
The change for low weight births is highly significant (p<.002). In particular, the rate of very low weight births (<1500 grams) nearly doubled, from 0.78% to 1.54%, although it falls short of statistical significance (p<.12) due to the relatively small number of cases.
Childhood and Adolescent Cancer. Another expression of harm from radiation exposure early in life is cancer to the child and adolescent. Damaged fetal and infant cells may take years before manifesting as an actual cancer that is diagnosed. Childhood cancer may be the most-studied health measure after radiation exposure, as there are dozens of medical journal articles published on this topic.
The CDC mortality web site from 1979-2008 can be used to examine trends in Monroe County’s child and adolescent cancer rates. Child cancer incidence often uses age 0-19; because cancer deaths often take several years to occur, Table 11 can use cancer deaths age 0-24. Again, the period 1979-1984 (before Fermi 2) is used as a baseline, compared with the 24 years following.
Table 11
Cancer Death Rates Age 0-24, 1979-1984 vs. 1985-2008
Monroe County MI vs. United States
PeriodMonroe U.S.% Monroe vs. U.S.
1979-19843.699 ( 13)4.889- 24.3%
1985-20084.444 ( 55)3.470+28.1%
% Change+52.4% p<.004
Source: U.S. Centers for Disease Control and Prevention, http://wonder.cdc.gov. Rates represent number of deaths from cancer per 100,000 persons. The ICD-9 codes used for the years 1979-1998 are 140.0-208.9, and the ICD-10 codes used for 1999-2008 are C00-C97.9.
In the years prior to the startup of Fermi 2, the local cancer death rate age 0-24 was 24.3% below the U.S. But in the years following, the local rate rose, while the national rate declined. The county rate in the period 1985-2008 was 28.1% ABOVE the U.S., based on 55 deaths (significant at p<.004). Moreover, in the most recent decade (1999-2008), the county rate was 50.2% higher (4.631 vs. 3.083 deaths per 100,000), suggesting rates are getting higher with time, and as the Fermi 2 reactor ages and its parts become more brittle.
Cancer in Young Adults. If children and adolescents are most sensitive to developing cancer from radiation exposure, it is a logical assumption that the next most sensitive group are young adults, defined in this analysis as age 25 to 44. CDC data on changes in Monroe vs. U.S. rates since Fermi 2 started up are presented in Table 12.
Table 12
Cancer Death Rates Age 25-44, 1979-1984 vs. 1985-2008
Monroe County MI vs. United States
PeriodMonroeU.S.% Monroe vs. U.S.
1979-198421.263 ( 49)27.254- 22.0%
1985-200825.581 (262)24.593+ 4.0%
% Change+26.0% p<.05
Source: U.S. Centers for Disease Control and Prevention, http://wonder.cdc.gov. Rates represent number of deaths from cancer per 100,000 persons. The ICD-9 codes used for the years 1979-1998 are 140.0-208.9, and the ICD-10 codes used for 1999-2008 are C00-C97.9.
The county rate before Fermi 2 started up was 22.0% below the U.S., but has since been 4.0% above the U.S., based on 262 deaths from 1985-2008 (significant at p<.05). In the most recent decade of 1999-2008, Monroe’s rate was 8.4% greater (based on 103 deaths), indicating again that local rates are continuing to rise over time.
Cancer Mortality – Very Elderly. Aside from younger populations, the group that is most sensitive to damaging effects of radiation is the very elderly, whose immune systems are becoming weaker, making them less likely to fight off a carcinogen such as radiation.
Table 13 shows the change in cancer death rates for Monroe County residents age 75 and older, compared to the U.S., in the periods before and after Fermi 2 started up.
Table 13
Cancer Death Rates Age 75+, 1979-1984 vs. 1985-2008
Monroe County MI vs. United States
PeriodMonroe U.S.% Monroe vs. U.S.
1979-19841375.5 ( 376)1318.7+ 4.3%
1985-20081505.7 (2462)1412.08+ 6.6%
% Change+ 2.3% p<.67
Source: U.S. Centers for Disease Control and Prevention, http://wonder.cdc.gov. Rates represent number of deaths from cancer per 100,000 persons. The ICD-9 codes used for the years 1979-1998 are 140.0-208.9, and the ICD-10 codes used for 1999-2008 are C00-C97.9.
The Monroe County increase from 4.3% higher to 6.6% higher is not as dramatic as those larger increases for younger populations. The change is not statistically significant, but does represent a large number of deaths (2462 Monroe County residents age 75 and older died of cancer from 1985-2008). In the most recent decade (1999-2008), the county rate was 10.2% above the nation, suggesting that the increase is continuing in the Fermi 2 era.
Cancer Mortality – All Ages. The Monroe County and U.S. changes in cancer mortality for persons of all ages before and after Fermi 2 startup were also examined. These figures are adjusted to account for age distribution, a commonly used epidemiological method when examining populations of all ages. Table 14 indicates these changes.
Table 14
Cancer Death Rates All Ages, 1979-1984 vs. 1985-2008
Monroe County MI vs. United States
PeriodMonroe U.S.% Monroe vs. U.S.
1979-1984211.27 (1231)207.83+ 1.7%
1985-2008213.25 (6540)200.45+ 6.4%
% Change+ 4.7% p<.14 (NS)
Source: U.S. Centers for Disease Control and Prevention, http://wonder.cdc.gov. Rates represent number of deaths from cancer per 100,000 persons, adjusted to the 2000 U.S. population. The ICD-9 codes used for the years 1979-1998 are 140.0-208.9, and the ICD-10 codes used for 1999-2008 are C00-C97.9.
Monroe County’s cancer death rate rose from 1.7% to 6.4% above the U.S. after Fermi 2 began operating. A total of 6540 deaths among county residents occurred in the 24-year period 1985-2008, but the change fell short of statistical significance at p<.l4. During the most recent decade (1999-2008), the county rate was 8.6% above the U.S., indicating that the increase is continuing. The racial mix doesn’t affect the rates much; in the period 1999-2008, the rate for non-Hispanic whites in Monroe County was 6.0% greater than the U.S., compared to 6.4% for all races.
The National Cancer Institute published a study in 1990 entitled “Cancer in Populations Living Near Nuclear Facilities.” The study examined cancer death rates near 62 U.S. nuclear plants in 5-year groups from 1950 to 1984, for all cancers combined and for 13 types of cancer. The study included statistics for Monroe County as that closest to the Fermi plant. Source: National Cancer Institute. Cancer in Populations Living Near Nuclear Facilities. NIH Pub. No. 90-874. Washington DC: U.S. Government Printing Office, 1990.
In the five-year period 1974-1978, after Fermi 1 had closed and before Fermi 2 had begun operating, the county mortality rate for all cancers combined was 11.3% below the U.S., based on 788 deaths. Thus, if this period was combined with 1979-1984, the Monroe cancer rate was below the U.S. – yet another example of a Monroe death rate below the nation before Fermi 2 was put into operation, only to approach or exceed the U.S. average after the reactor went critical.
Cancer Incidence, Most Common Cancers. While historical cancer mortality (death) data is available for the past 30 years for each state, such is not the case for cancer incidence (cases). Each state developed its cancer registry for newly-diagnosed cases at a different point in time, and thus the National Cancer Institute makes state- and county-specific incidence data available only for the period 2004-2008, making any historical trend analysis impossible.
However, the Michigan Department of Community Health makes annual county-specific cancer incidence data available on its web site beginning in 1985 and ending in 2007. All cancers combined are provided, along with the four most common malignancies (female breast, colorectal, lung, and male prostate), which make up about 55% of all diagnosed cases of cancer.
While there is technically no data prior to the startup of Fermi 2 in 1985, the period 1985-1987 can serve as a “before startup” period, since most cancers that would be affected by emissions from Fermi 2 would occur at least two years after startup. Thus, Table 15 shows the changes in incidence for Monroe vs. the U.S., for the periods 1985-1987 and 1988-2007.
Table 15
Cancer Incidence Rates, All Ages, 1985-1987 vs. 1988-2007
Monroe County MI vs. United States
PeriodMonroeU.S.% Monroe vs. U.S.
All Cancers Combined
1985-1987268.5 ( 868)456.1- 41.1%
1988-2007434.7 (11514)483.4- 10.1%
% Change+30.0% p<..000001
Female Breast Cancer
1985-1987 64.1 ( 113)128.5- 50.2%
1988-2007101.1 (1481)132.6- 23.7%
% Change+26.5% p<..00001
Colorectal Cancer
1985-1987 34.0 ( 104) 64.4- 47.3%
1988-2007 53.1 (1358) 54.6- 2.8%
% Change+44.5% p<..00001
Lung Cancer
1985-1987 52.5 ( 174) 66.1- 20.6%
1988-2007 75.0 (1977) 65.8+ 14.0%
% Change+34.6% p<..00001
Male Prostate Cancer
1985-1987 58.9 ( 61)122.8- 52.0%
1988-2007134.7 (1479)177.5- 24.1%
% Change+27.9% p<..00002
Sources: Michigan Cancer Registry, http://www.michigan.gov/mdch/0,4612,7-132-2944_5323---,00.html (Monroe County data). Surveillance, Epidemiology, and End Results system (www.seer.cancer.gov, Cancer Statistics Registry, 1975-2008). U.S. rates consist of the states of Connecticut, Hawaii, Iowa, New Mexico, Utah, and the metropolitan areas of Atlanta, Detroit, San Francisco, and Seattle, Rates represent number of cancer cases per 100,000 persons, adjusted to the 2000 U.S. population.
For all cancers combined, and for each of the four most common cancers, the Monroe County incidence rate was below the U.S. in 1985-1987. All of the rates rose in the next 20-year period, although all are still below the U.S. (except for lung cancer, which is now 14% higher). The large numbers of cancer cases (11,514 in the 20 year period 1988-2007) make the results for each of the five cancer types highly statistically significant.
Mortality, All Other Causes. Cancer is disease most strongly linked with the hazardous health effects of radiation exposure. However, the fact that radiation from nuclear reactors destroys and injures cells, impairing the immune system’s ability to fight disease can increase the risk of other conditions such as heart, digestive, and respiratory diseases.
Table 16 shows the change in Monroe vs. U.S. mortality rates for all causes of death except for cancer, for the pre- and post-Fermi 2 startup periods.
Table 16
Non-Cancer Death Rates All Ages, 1979-1984 vs. 1985-2008
Monroe County MI vs. United States
PeriodMonroe U.S.% Monroe vs. U.S.
1979-1984814.84 (4441) 794.01+ 2.6%
1985-2008703.03 (20507) 676.30+ 4.0%
% Change+ 1.4% p<.41 (NS)
Source: U.S. Centers for Disease Control and Prevention, http://wonder.cdc.gov. Rates represent number of deaths from cancer per 100,000 persons, adjusted to the 2000 U.S. population. The ICD-9 codes used for the years 1979-1998 are all except 140.0-208.9, and the ICD-10 codes used for 1999-2008 are all except C00-C97.9.
The non-cancer death rate in Monroe County made a modest increase from 2.6% to 4.0% since Fermi 2 began operating, not significant at p<.41. The 4.7% excess for the most recent decade (1999-2008) was greater than the prior periods (2.6% for 1979-1984, and 3.3% for 1985-1998), showing a steady rise continuing into the most current period
Hospitalization Rate. The state of Michigan Department of Community Health also provides county-specific data on rates of hospital admissions for the period 2004-2008. While trend analysis is not possible, comparing Monroe County with the state may be indicative of potential health problems. Table 17 provides current hospitalization rates for all causes, plus cancer and birth defects, the conditions most closely connected with radiation exposure.
Table 17
Hospitalization Rates, 2004-2008, Selected Conditions
Monroe County MI vs. Michigan
Period Monroe Mich.% Monroe vs. Mich.
All Ages
All Causes 1399.2 (107,465) 1315.6+ 6.3% p<.000001
Malignant Cancer 43.7 (3360) 42.3+ 3.3% p<.68 (NS)
Benign neoplasms 20.4 (1570) 14.8+37.8% p<.000001
Age <18
Congenital anomalies 10.8 ( 200) 10.4+ 3.8% p<.71 (NS)
Malignant cancer 3.2 ( 60) 2.5+28.0% p<.18 (NS)
Source: Michigan Department of Community Health, www.michigan.gov/mdch, statistics and reports. Rates represent number of hospital admissions per 10,000 persons.
The hospitalization rate for Monroe County was 6.3% higher than the state for the period 2004-2008, which is significant due to the very large number of admissions (107,465). In 2009, the county rate of 1477.1 was 11.7% greater than the state rate of 1322.7 per 10,000 persons, based on 22,559 hospitalizations, signaling that the county-state gap may be growing.
Hospitalization rates for cancer – both malignant and benign – of all ages were greater in Monroe County vs. the state, as were rates for children under age 18 for cancer and congenital anomalies (birth defects). Of the five hospitalization measures here, two were statistically significant.
DISCUSSION
The proposed new Fermi 3 nuclear reactor raises a number of health concerns that should be addressed before any decision is made on whether to allow the reactor to be constructed. Assessing the potential environmental impact of Fermi 3 would be much more evidence-based if a “report card” on the performance of previous Fermi reactors, especially Unit 2, were part of the assessment. Unfortunately, the U.S. Nuclear Regulatory Commission does not require any such review, and thus, the EIS for Fermi 3 did not address the record of operations and health risks to the local population.
This report analyzes data on Fermi 2 in two areas: environmental contamination and trends in local health status. The environmental contamination section first addressed releases from a meltdown. Because of the 1966 meltdown at Fermi 1; the aging, corroding reactor at Fermi 2; and the reality that human error (Chernobyl), act of nature (Fukushima), and act of sabotage (if a terrorist attack struck a reactor) could cause a devastating meltdown at a plant with 4.8 million residents within 50 miles, the meltdown threat posed by a Fermi 3 is serious and should be strongly weighed in any decision on whether to allow its building.
The other type of radioactive contamination addressed in this report was that of emissions routinely released into the environment by Fermi 2. Several types of radioactive chemicals were examined, and in each, Fermi’s releases were greater than most U.S. nuclear reactors.
This report then examined trends in a variety of health status indicators since the 1980s, before and just after Fermi 2 came online. The Monroe County disease or death rate was compared to the state or national rate, for the “before” and “after” periods. The indicators were those believed to be most sensitive to radiation exposure, including infant deaths, low weight births, cancer mortality (all ages, children, young adults, and the very elderly), cancer incidence (all cancers, plus breast, colorectal, lung, and prostate cancer), plus hospitalization rates for cancer and birth defects.
For 19 of 19 indicators, the increase in the Monroe County rate exceeded the increase for the state or nation. Of these, 10 achieved statistical significance, with 4 others that approached significance. More analysis is merited here, but these strongly consistent findings should be taken seriously.
In closing, basic data on the performance of Fermi 2 strongly suggests Fermi 3 will pose a safety and health risk for local residents. Accordingly, the conclusion of this report is that no decision should be made on whether or not to approve a license for Fermi 3 until more research of this type is undertaken. A baseline health study by independent experts is needed, along with a thorough public education and discussion process, to ensure whether the majority of local people approve of the new reactor after acquiring this additional knowledge.
Waterkeeper Alliance (tect only) TOP
January 11, 2012
Email to: Fermi3.COLEIS@nrc.gov
Docket ID NRC-2008-0566
Draft Environmental Impact
Statement for Combined License (COL)
for Enrico Fermi Unit 3
report number: NUREG-2105
Please accept the following comments submitted by Sandy Bihn, Lake Erie Waterkeeper
Fermi 3 Comment
1.Section 5.221 Line 1 after line 16 states that the Great Lakes Compact of 2008 requires that any new water use of more than 5 MGD be subjected to a regional review. Therefore, Fermi 3 would be subject to such a review by the other Great Lakes States and provinces.
While this statement is correct, the State of Michigan has also adopted a water withdrawal model that should be part of this review.
The EIS should include the analysis that is required in the Great Lakes Compact and the review required by Michigan DEQ for the 49.3 million gallons per day withdrawal from western Lake Erie. The EIS needs to incorporate these element, not have them determined independently. This information should have been part of the EIS.
2.Section 5.221 line 12 and forward discusses the volume of water that Detroit Edison will use for Fermi 3. The estimate provided is .006 percent of the total volume of water in all of Lake Erie. Fermi 3 is to be located in the shallowest part of Lake Erie – the western basin which holds only 5% of the total volume of Lake Erie water. Rather than .006 percent of the total Lake Erie water volume, the EIS should base the analysis of water in the Western Lake Erie basin. This means that the volume of water used would be .1727 percent of the western Lake Erie volume. This is based on 5% of 116 cubic miles = 5.8 cubic miles, .00006 times 116 equals .00696 cubic miles, .00696/5.8 cubic miles equals .12% of the water use in western Lake Erie where the plant is located, significantly more than .006% in the report.
Furthermore, the total volume of water used by DTE from western Lake Erie in the Monroe, Michigan area adds up to 4.8% of the water in the western basin of Lake Erie. Given the current algae crisis in Lake Erie, especially western Lake Erie the volume of water used in the basin with the increased discharge temperature decrease western Lake Erie water quality and increase algae growth.
3.Section 5.2.3.1 discusses the mixing zone/thermal plume as be about 55,000 square feet. This conflicts with a recent mixing zone/thermal study conducted by BP for Ohio EPA in Maumee Bay in about eight feet of water which is about the same as Fermi 3’s estimated depth. That study showed the plume extending in some cases over one mile – significantly more than the Detroit Edison information suggests and from some research it appears that the same model was used. NRC should review the BP thermal report recently completed which includes analysis of fish kills and determine why there are such discrepancies in the mixing zone calculations.
Also, if the calculations used in the thermal plume model use the entire volume of water in Lake Erie rather than the volume of water in the western basin, then the calculations for the thermal plume are understated.
In addition there is a 2011 report by Limnotech that shows algae in the area of where Fermi 3 is to be built is not reported or discussed in the EIS. The growing algae problem in Lake Erie decreases water quality and caters to fish that live in lower water quality.
4.NOAA MODIS satellite imagery available for Lake Erie in 2011 shows massive algal blooms along the Monroe shoreline from July through October. Researchers say that the Lake Erie 2011 algal bloom was the largest ever recorded. Detroit Edison in their EIS depicted Lake Erie as being healthier and thriving when in fact the water quality and types of aquatic habitat it can support are declining. USEPA, Ohio EPA and others can verify the growing algae problem in Lake Erie. The Fermi Three plant will heat an estimated additional .12% of the water in western Lake Erie that will contribute to undesirable toxic algae growth which is a threat to human health and the environment. Contribution to algae growth and degradation to the fish population from the additional algae was not evaluated in the EIS.
5.Fish kill estimates are based on Fermi 2 counts. There is no analysis for Fermi Three of the incremental impact of additional fish kills in an already stressed western Lake Erie watershed. How many fish would Fermi 3 have to kill before there was an adverse impact on walleye and yellow perch populations in western Lake Erie either from the species themselves being killed or from the forage fish needed to support the walleye and yellow perch populations.
6.Section 5.2.2.1 line 6 page 5-9 talks about the water quantity withdrawal impacts when considering the Monroe/Frenchtown water intake. There is no discussion of the impact on the water intake waters from the discharged waters of Fermi 3 – both from water quality changes and from temperature changes. The State of Oregon bans drinking water intakes from being in a mixing zone. Given the shallow nature of the water – estimated at 8.5’, it is imperative that the EIS include an analysis of impacts on the Monroe drinking water intake for the public health – both from increased temperatures and increased chemicals in the water.
Attachment A Size of thermal plume Bayshore power plant. Note that OEPA suggests that the thermal plume/mixing zone predictive model underestimates the size of the thermal plume. Given the conservative estimate below, Bayshore uses about 750mgd with ‘an underestimated’ average observed plume size of 216 acres while the model shows 84 acres, which is 2.52 times the model. If this observation would apply to Fermi 3, then the plume size would be 55,000 sq. ft. times 2.57 = 141,350 sq. ft.
This from a 2004 Ohio EPA Update of the Bayshore Power plant.
Attachment B USGS comments on DTE 316 fish kills etc. for the coal fired power plant which may be applicable to Fermit 3 - attached
Watch NRC stops Whistleblower Protection on You Tube:http://youtu.be/y4-HPgGRFG0
UPDATE:
Despite Public Outcry and Environmental Opposition, DTE was awarded a license to build FERMI 3 atop a wetland with an endangered species, Fox Snake living in the habitat. DTE said that it has no intentions to build FERMI 3 (2017) because of extensive costs to build it.
Source: NPR
Sister Site: